SUBHEAD: NASA maps area of continental United States for "above ground woody biomass" - or in English "tree cover".
By Alex Davies on 22 January 2012 for TreeHugger -
(http://www.treehugger.com/natural-sciences/nasa-maps-americas-trees.html)

Image above: The ridgebacks of the Appalachian Mountains is the bulk of forests left in the United States with a strip running along the Sierra Nevada Mountains and into the Pacific Northwest. Heading due west from Cleveland, Ohio, there are no great stands of forests all the way to California and the southern Cascade Mountains. From (http://eoimages.gsfc.nasa.gov/images/imagerecords/76000/76697/whrc_carbon_us_lrg.jpg). Click to enlarge.
One of the harder things about proving climate change and other large-scale trends is that they're slow processes. Year-to-year data can't prove anything conclusive, and data from 10, 20 or 100 years ago is rarely as complete as we would like it to be. That's why the NASA Earth Observatory set out six years ago to create a map of the country's trees. Now scientists have a conclusive picture of today's forests, which are crucial to storing carbon and keeping its presence in the atmosphere pin check.
The map, which actually measures "aboveground woody biomass" in tons per hectare, was created by Josef Kellndorfer and Wayne Walker of the Woods Hole Research Center (WHRC), along with colleagues at the U.S. Forest Service and U.S. Geological Survey.
Forests store huge amounts of carbon- NASA says up to 45%- of the global supply. The loss of forests means the release of carbon; massive deforestation means unusually high atmospheric levels of carbon, and the rise of global temperatures (albeit with the occasional exception).
The goal of the NASA forest map is not to establish any change in national tree coverage, but rather to have a conclusive picture of what's here now- so future scientists and citizens know what's changed, and what needs to be done differently.
.
By Alex Davies on 22 January 2012 for TreeHugger -
(http://www.treehugger.com/natural-sciences/nasa-maps-americas-trees.html)
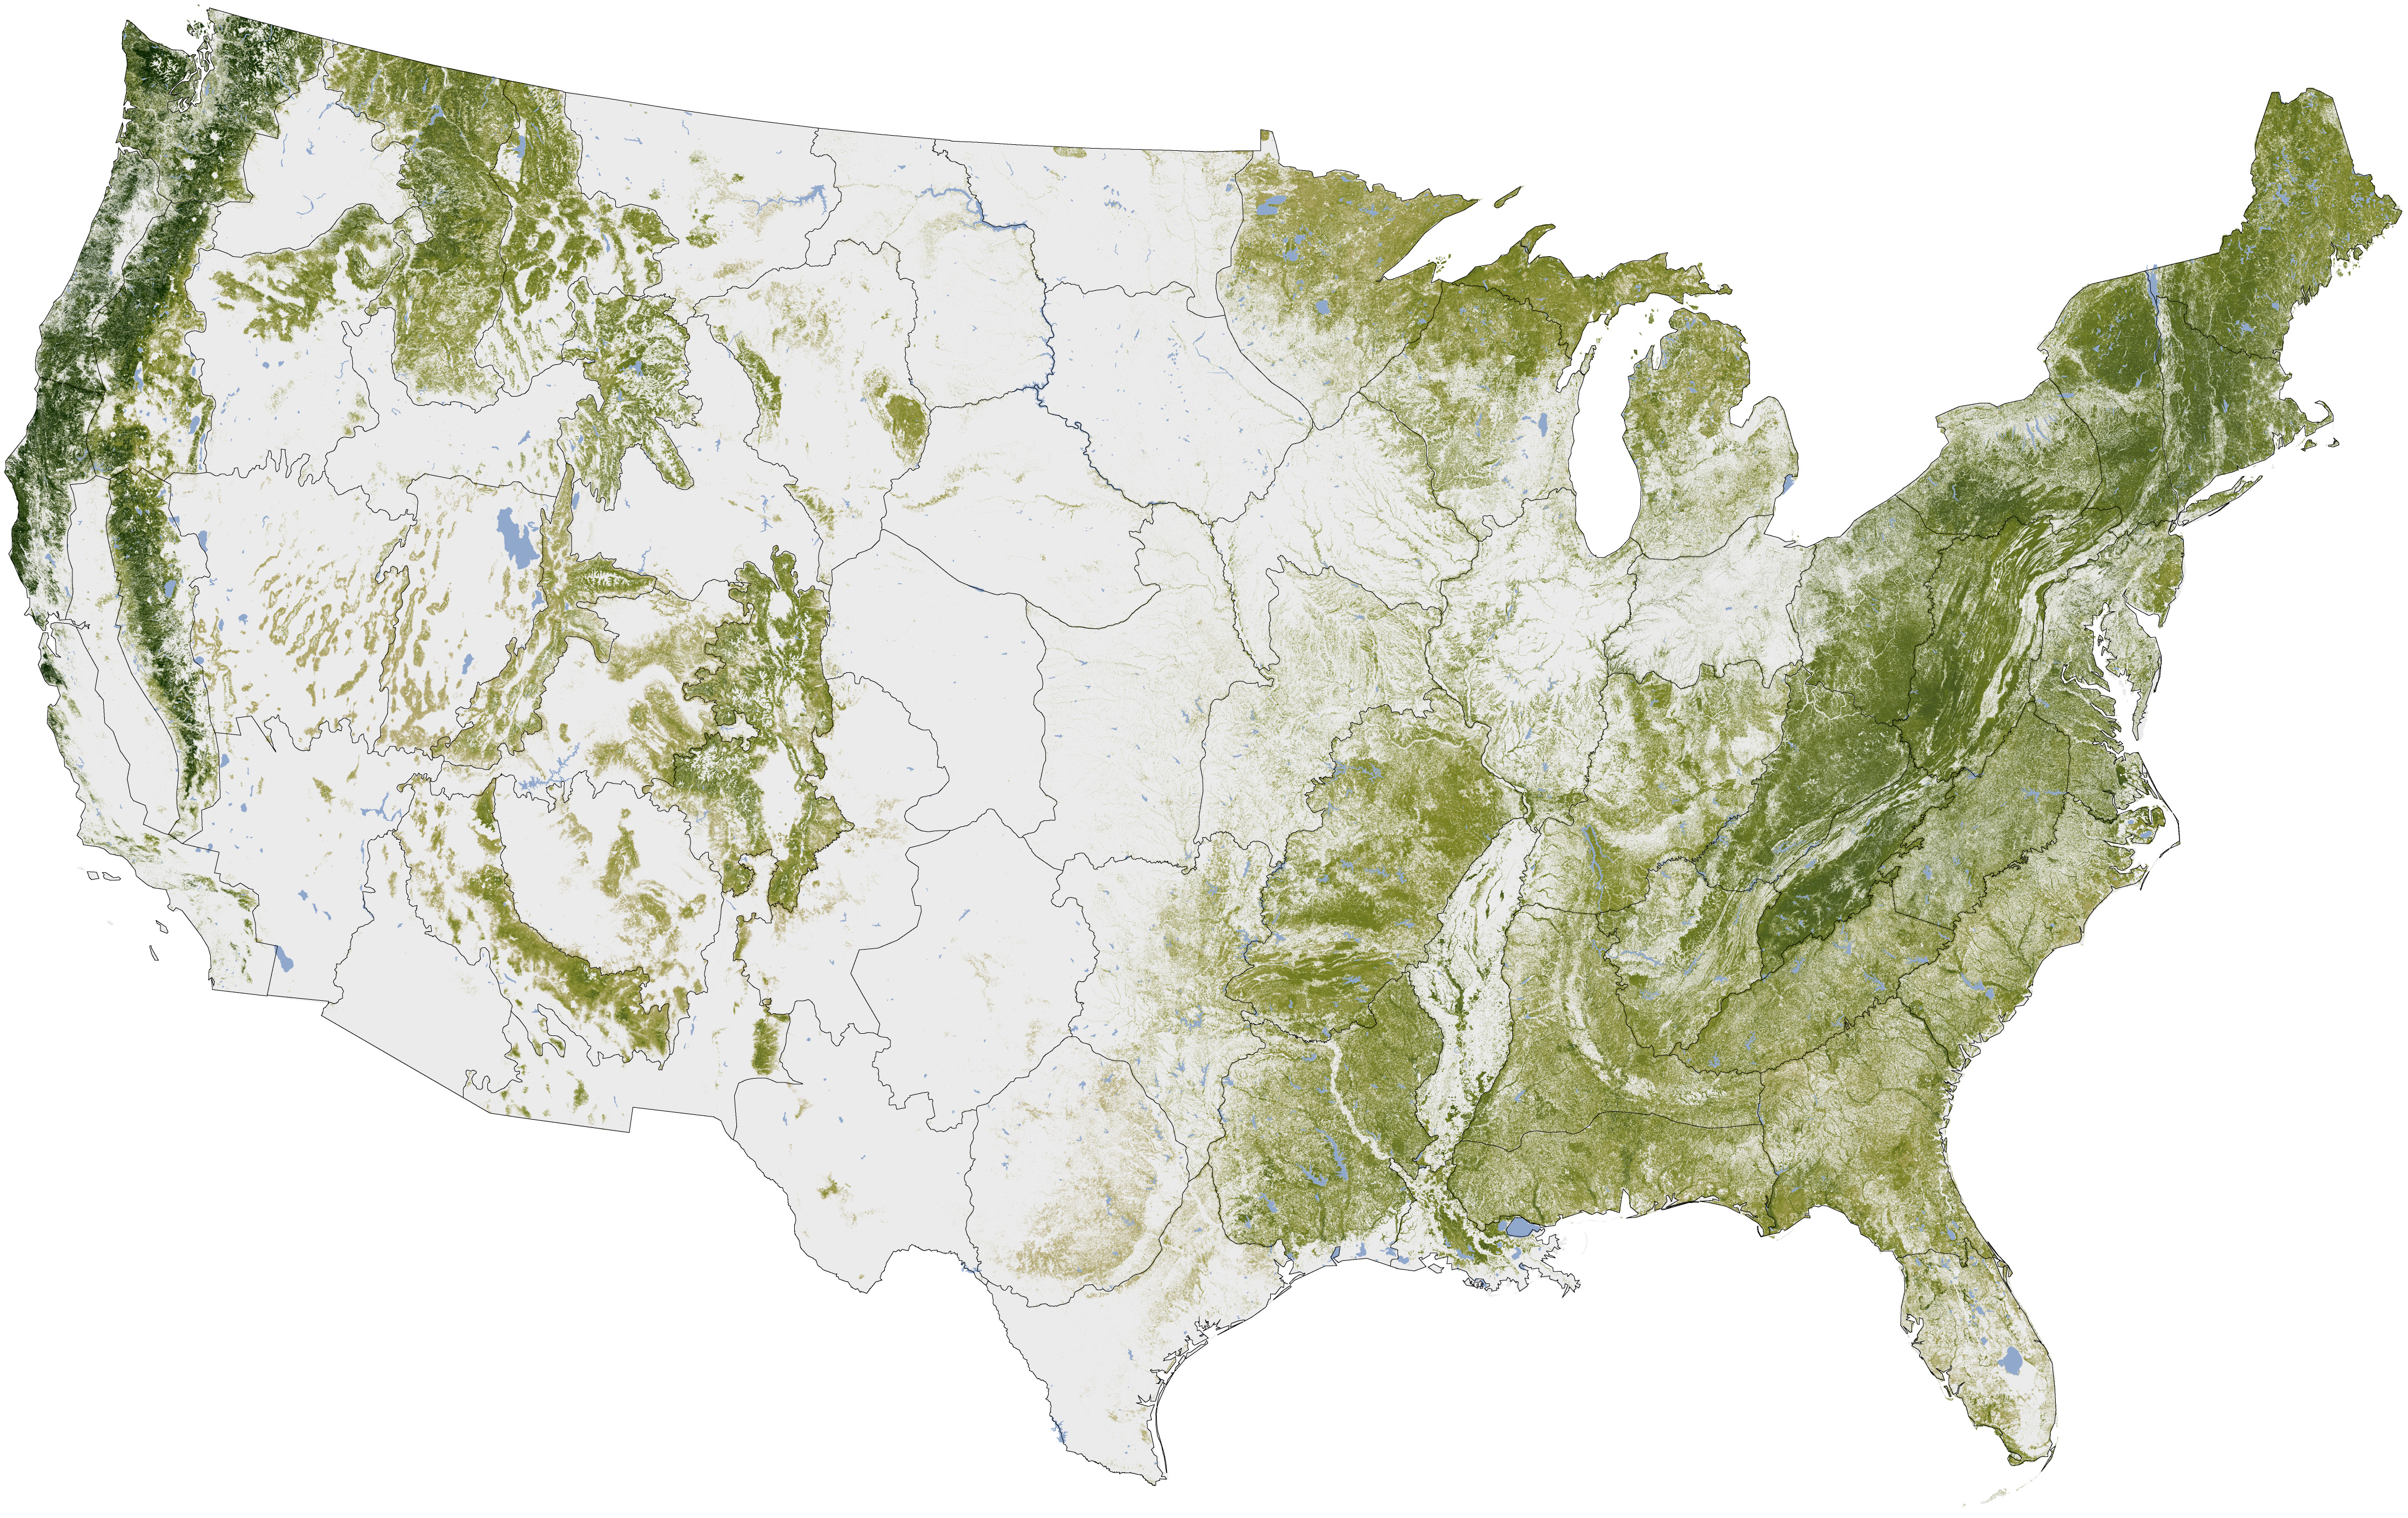
Image above: The ridgebacks of the Appalachian Mountains is the bulk of forests left in the United States with a strip running along the Sierra Nevada Mountains and into the Pacific Northwest. Heading due west from Cleveland, Ohio, there are no great stands of forests all the way to California and the southern Cascade Mountains. From (http://eoimages.gsfc.nasa.gov/images/imagerecords/76000/76697/whrc_carbon_us_lrg.jpg). Click to enlarge.
One of the harder things about proving climate change and other large-scale trends is that they're slow processes. Year-to-year data can't prove anything conclusive, and data from 10, 20 or 100 years ago is rarely as complete as we would like it to be. That's why the NASA Earth Observatory set out six years ago to create a map of the country's trees. Now scientists have a conclusive picture of today's forests, which are crucial to storing carbon and keeping its presence in the atmosphere pin check.
The map, which actually measures "aboveground woody biomass" in tons per hectare, was created by Josef Kellndorfer and Wayne Walker of the Woods Hole Research Center (WHRC), along with colleagues at the U.S. Forest Service and U.S. Geological Survey.
Forests store huge amounts of carbon- NASA says up to 45%- of the global supply. The loss of forests means the release of carbon; massive deforestation means unusually high atmospheric levels of carbon, and the rise of global temperatures (albeit with the occasional exception).
The goal of the NASA forest map is not to establish any change in national tree coverage, but rather to have a conclusive picture of what's here now- so future scientists and citizens know what's changed, and what needs to be done differently.
.
No comments :
Post a Comment