SUBHEAD: An examination of sustainable yield in England on twenty hectares with twenty residents.
[IB Publisher's note: This article has been updated on September 9th with the addition of Chris Smaje calculations on nutritional yields from the farm he modeled.]
By Chris Smaje on 30 August 2016 for Small Farm Future -
(http://smallfarmfuture.org.uk/?cat=6)
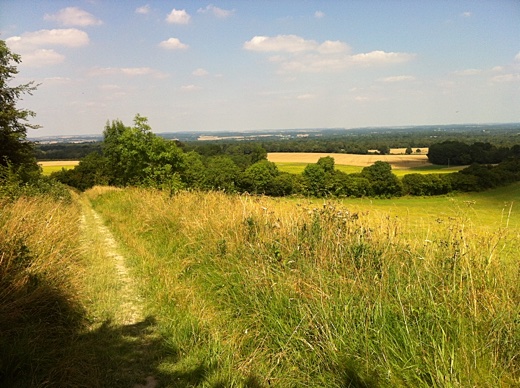
Image above: Photo of the countryside of North Wessex Downs. From (https://fourpointmapping.wordpress.com/2012/10/19/north-wessex-downs-survey/).
[IB Publisher's Note: This article has important information on land area and yields of organic products in the temperate climate of Wessex, England. Metric system measurements are used throughout and will need to be converted for use in the United States (largely because of Ronald Reagan's rejection of modernizing America to the will of rational science. As a result many measurements may not be intuitively understood by readers of this blog. Approximations are:
Right, no more faffing around. Without further ado, I’m going to describe the layout of an ‘average’ 10 hectare holding in the Peasant’s Republic of Wessex, circa 2039, as introduced in various preceding posts. The holding, remember, has 10 whole-time equivalent workers, and ten dependents (children/elders).
I’m going to play around with those figures in due course, but let’s stick with them for now – so imagine 10 people doing the work implied in what I outline below. As to what energy sources they’ll have available…well, I’ll come to that when I’m ready.
Please shout out if you don’t like any of the numbers I’m about to throw around
1.The structure of the holding
First, I’m going to take out 3.5% or 3,500m2 of the land area on my 10ha holding for houses, outbuildings and tracks.
Each of the five houses on the holding gets their own 250m2 organic vegetable garden, totalling 0.125ha in all.
There’s just under 1.4ha of cropland, farmed organically, which the residents jointly tend.
There’s about 6ha of grass for grazing, comprising about 5ha of permanent pasture, a 0.5ha orchard with fruit and nut trees and grass in between for grazing (the trees may need some protection), and almost 0.5ha of temporary grass/clover ley in the cropland available for grazing.
There’s about 2.5ha of woodland.
2.The cropland
In a real situation, I think people would grow a pretty wide range of crops, a lot of them minor ones occupying small areas. I don’t see it as my job to lay out in exhaustive detail exactly what all these crops might be, so for this exercise I’m restricting the cropping to a relatively small range of fairly obvious crops. I’m interested in any suggestions for refinements, particularly if they come with reasons as to why it’s important to include them.
In relation to crop yields, I have three sources of data. First, my own data back from the days around 2010/11 when I was young and enthusiastic and I could be bothered to keep meticulous cropping records. Second, I have data in the form of a sneak preview from my friend Rebecca Laughton’s fascinating forthcoming study of small farm productivity in the UK.
And finally, I have data from my copy of the 2011/12 Organic Farm Management Handbook. If I get a few more donations to the website I might splash out on a newer version, and update the figures.
In keeping with my preference to err on the side of under-estimating rather than over-estimating yields, in each case I’ve taken whichever of my three data sources reports the lowest average yield. I think the yield per hectare figures I’m assuming generally are on the low side, but I’d welcome any comments.
Other sources of data I’ve used are further referenced below.
One other point: some people like to stress the yield advantages of backyard scale, labour intensive mixed cropping and might therefore think that the yield data I’m using from commercial-scale single-crop systems underestimates the possibilities. I’ve explained here why I’m a bit sceptical about the claims made for mixed cropping. And in any case, as I’ve just said, I don’t mind underestimating a bit.
Where I have made minor allowance for the benefits of small scale is in the issue of edge. I don’t go with the over-mystical enthusiasm for edge associated with the wilder shores of the permaculture movement, but look at it this way: a square 10ha field has a perimeter of 1,265m.
You could sow wheat in the field while establishing around 300 apple trees around the perimeter with essentially no loss of growing space for the wheat.
A cereal farmer with a large number of 10ha fields isn’t going to do that. But 10 neo-peasants living in a 10ha field probably are. So in that way we can increase the effective growing area of the field using nothing but the magic of human labour and linear planting, so long as we don’t push that logic too far…
OK, so let’s look at what’s in the shared cropland. First up, I’m going to set aside about 350m2 to grow hemp and flax in order to make clothes. Personally I prefer wearing cotton and synthetic fibres and would probably be willing to spend some of my off-farm household income on that if it wasn’t too expensive, but let’s go with the home-grown option.
I’ve taken figures for hemp and flax from Simon Fairlie’s ‘Can Britain feed itself?’1 – it amounts to about 7kg of fibre per person per year.
The rest of the cropland is split into an eight course rotation, each course occupying just under 1,700m2. The rotation I envisage is as follows (though not necessarily in this chronological sequence):
Wheat’s co-product, straw, would be in high demand around the holding – one reason for growing a traditional long-straw variety, as suggested by Michael under a previous post.
Yield figures for potatoes, wheat and legumes are further corrected for seed input. The other crops aren’t corrected, on the grounds that it’s fairly negligible.
3.The Garden
In the garden, I’m projecting seven crops, though in reality there’d be more:
4.The Orchard
In a 0.5 ha orchard, I think there would be space for:
5.Livestock and Meat
(i) Cows
I have little experience of dairying, so I’m a bit uncertain of these figures and would welcome any comments. But the most efficient way of getting useful human food from grass is via a dairy cow, so there will be cows on my holding.
These will be more or less pure grass-fed house cows, not souped up (or at least soya and cerealed-up) champion milkers of the modern kind. They will have preferential access to the clover-rich leys on the cropland and will otherwise be part of a grazing rotation over the permanent pasture.
I’m assuming 1 ha of grazing will feed a cow and her calves over the year, and yield 4,000 litres of milk, plus 90kg of meat per hectare per year from the calf (slaughtered at 2 years, and with some kept as cow replacements after 10 years).
There’d probably be a need for careful pasture management (and maybe occasional reseeding?) to ensure a relatively high-productivity pasture (white clover, perennial ryegrass etc.)
There would be 3 house cows on the holding. About a fifth of their milk would be kept for direct human consumption, which works out at about 300ml per day for each of the 20 people on the holding.
he rest of the milk would be turned into butter and cheese. I’m assuming about half of it will be devoted to butter, with 20 litres of milk producing 1kg of butter (I’m anxious that my neo-peasants have enough fat to eat and to cook with).
And just under a third is devoted to cheese, with 8 litres of milk going into each kg of cheese. The butter and cheese-making processes give the co-products of buttermilk and whey respectively (90l of buttermilk per 100l of milk for butter, and 87l of whey per 100l of milk for cheese). A little bit of this will be eaten directly by the people on the holding, but most of it will be used to feed pigs (see below).
(ii) Sheep
I’m assuming that a hectare of permanent pasture could support 6 ewes plus their lambs (and a ram, or part thereof) year round. I think that’s a pretty low estimate, but it provides a bit of extra margin for the cows.
The sheep would be on just under 3 ha of the permanent pasture, and there would be about 18 ewes in all, each producing 1.5 lambs annually on average. Ewes would be culled on average at five years, with lambs raised to replace them.
On the basis of those assumptions, the sheep would produce 544kg of meat (lamb and mutton) per year, plus some wool and other bits and pieces which would doubtless come in handy. Rotating them around the pasture with the cows would help to keep the worm burden down.
(iii) Pigs
I’ll start with the assumption that I can raise two pigs in the woodland. I know this is cheating a bit, but I’ll have a clearing in the woodland in which I can grow some clover and fodder beet for them. They’ll also get to eat waste material from the gardens and kitchens (there’s no swill ban in the Peasant’s Republic of Wessex).
This is pretty much what I do now, and I reckon I could easily raise two almost-default pigs this way. But I’m worried that my neo-peasants aren’t going to have enough easily available fat, so I’d like to raise some more pigs.
If I reserve all but 5% of the buttermilk and whey from the dairy as pig food, and on the assumption that you have to put about six times more energy into a pig than you get out, I reckon I can raise another four pigs from the dairy.
I think there’ll also be a bit of a surplus of potatoes and beans from the field crops, so I’m going to devote something like 650kg of the potato crop and 150kg of the bean crop to pig food, getting an extra three pigs. And that should give us about 400kg of pig meat per year altogether (I’m assuming smaller, leaner pigs at slaughter than the current commercial norm – killing out at 44kg, which was the weight of my default-raised Tamworths last year).
We should be able to get a good few kilos of lard out of the pig meat (and a little more from the beef) which, together with the butter, will be our cooking fat. Having nine pigs in the woodland may trash the ground a bit, but on the basis of my current pig-keeping experiments I think it’d probably be
OK – the average holding would just be raising weaners during the warmer months, which limits the damage.
(iv) Ducks and/or hens
Personally I prefer ducks to hens – better for eating slugs, the No.1 garden pest in Wessex. Though hens are better with some of the insect pests. And ducks’ waddling is less destructive of the ground than chickens’ scratching.
And since I don’t have a TV or young children, ducks are also better at the slapstick humour otherwise missing from my life. But, ducks or hens, my assumptions are basically the same – I’ll have ten of them, each laying on average 285 eggs per year, and requiring about 10kg of feed a week.
Half of that will come from their foraging free-range – well, not entirely free-range, but probably a lot more free-range than the ‘free-range’ products in the shops. The other half will come from the wheat. Talking of free-range, that reminds me that at some point I need to discuss fencing. But not right now.
At the end of their laying lives I guess I’d put the ducks and/or hens in the pot. But the amount of meat isn’t much to write home about, so I’ll ignore it. Meat hens/ducks of course are an option, but a less efficient one. I’m not including any here.
(v) Geese
There’ll be five geese, to be eaten at Christmas, or solstice, or whatever Dionysian rites there are in 2039 to keep the winter blues at bay. The geese will fight it out with the cows and sheep for grazing during the year.
(vi) Bees
There’ll be bees, helping with pollination as well as providing honey, wax, propolis etc. But I don’t think there’ll be much honey, because they need it more than us and we won’t be poisoning them with sugar. So let us say we’ll have just 10kg each year to put by for a rainy day.
(vii) Fish
Fish are efficient converters of fish-food into human-food, and before we became habituated to sea-fish and salmonids, fishponds were a ubiquitous part of the farmed British landscape. I’m sure that there would be neo-peasant fish farmers in Wessex. But most fish farming systems I’ve seen are high input as well as high output and quite energy/building intensive, so I really have no idea how to make realistic estimates.
Therefore I’m going to ignore farmed fish. Likewise with wild freshwater fish. I’m sure people in Wessex would fish in its lakes and rivers, though with so many people around they’d have to be careful not to fish them all out. So I’m going to leave freshwater fish as another under-exploited margin in my analysis.
Sea-fish, on the other hand, seems like a margin worth exploring, given the historic importance of fishing in Wessex, the hundreds of miles of coastline, and the nutritional excellence of wild fish. But it’s a bit tricky coming up with an estimate of sustainable catch.
And perhaps also thinking about fishing technology in a potentially energy-constrained future – though, more than with most things, perhaps the sun, wind and brine of the maritime environment suggests ways that it could be done using mostly renewable inputs.
I confess that I was fairly ignorant about the UK fishing industry until I obtained a copy of the UK Sea Fisheries Statistics and achieved instant enlightenment. Did you know, for example, that 418,000 tonnes of pelagic fish were landed by UK vessels using demersal trawl/seine gear in 2014? Seriously? Well do try to keep up.
I thought long and hard about how best to convert current catch statistics into something that seemed likely to be sustainable. In the end, I plumped for the simple expedient of limiting the catch to that which is currently brought in by UK boats of under 24m, constituting a mere 25% of their total catch. Allocated out on a per capita basis that gives everyone about 2½kg of fish per year each.
My friend Paul has used a more elaborate methodology, looking at estimated sustainable fish stocks from the European Atlas of the Seas, applying it to fishery zones of the western seaboard and allocating it out accordingly to the people of Wessex.
He comes up with the much larger figure of 36½kg of fish per person per year (doubtless my figures are biased towards the considerably smaller onshore fishery while his include more distant offshore fisheries).
I propose in time-honoured fashion to split the difference, giving my neo-peasants 19½ kg of fish each per year. This, incidentally, is the only source of food they get from off the holding.
(viii) Meat – A Summary
The holding’s pastures drive its meat productivity, particularly through the medium of its dairy cows. So my assumption of 1 cow plus calves per hectare is key.
I hope it sounds reasonable. To put it into context, in his ‘restoration agriculture’ system, Mark Shepard proposes to produce just under 20,000 litres of milk and just over 1,200kg of meat from one hectare of his Wisconsin farm2, something that elsewhere I’ve suggested seems implausibly optimisitc3.
Here, I’m proposing to produce 4,000 litres of milk and 168kg of meat from one hectare of a Wessex neo-peasant farm. I guess you could call Wessex the Wisconsin of England, only with a few more people and a few less lakes. And, apparently, a lot less meat and milk.
6.Other Food
It shouldn’t be hard to produce 15kg of fresh shiitake mushrooms on logs cut from the woodland each year.
And it shouldn’t be hard for the kids to harvest 10kg of blackberries from the woodland and hedges, along with 10kg of sea buckthorn berries that will have been strategically planted along one of the holding’s many edges.
In fact, there’s huge scope for growing a lot more in the way of fruit and nuts along these edges, but I’ll leave things at that low level to create another underexploited margin.
I’m not convinced that there’s all that much scope for bushmeat from the holding. I doubt many people will be raising game birds in the Peasant’s Republic of Wessex (there’s no Duchy of Cornwall, remember), so that pretty much leaves us with deer, squirrels, rabbits and pigeons.
Usually, I find it more trouble than it’s worth to go after these creatures, though sometimes either luck or fury at their crop depredations brings some of their meat to my table.
Teenagers with guns around the place can help – though remember there’s 20 people in every 10 hectares, so if you’ve got a rifle make sure you aim it downwards. Anyway, I’m estimating a parsimonious 4kg of bushmeat per holding per year.
Doubtless there’s some scope for collecting wild plants and mushrooms, and for developing invertebrate farming with good input/output ratios (mussels, snails, insects etc.) But again I’m going to leave all that as an unexploited margin.
Well, there you have it. The full dope on the neo-peasant holding. In my next post I’ll plug all of that into my magic spreadsheet to reveal the nutritional consequences of the Wessex way of life.
References
Nutrition yield in neo-peasant Wessex
SUBHEAD: Quantifying nutritional yield from our Neo-peasant Wessex farm model. Two people per hectare works.
By Chris Smaje on 9 September 2016 for Small Farm Future -
(http://smallfarmfuture.org.uk/?p=1074)
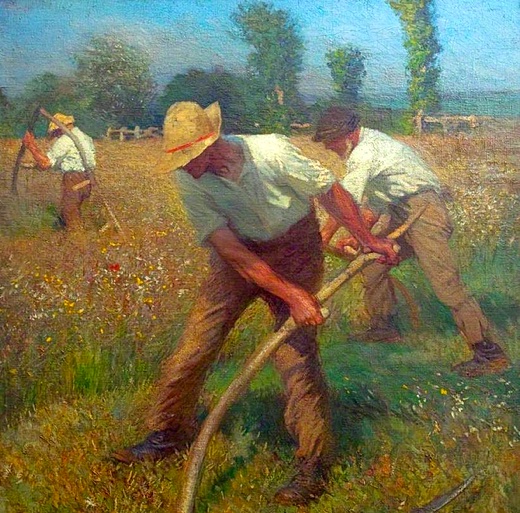
Image above: Painting of English peasants reaping grain by George Clausen. From (http://thedeliberateagrarian.blogspot.com/2014/03/the-english-peasant-art-of-sir-george_9.html).
In my last post I presented a picture of the production on an ‘average’ 10 hectare holding in the future Peasant’s Republic of Wessex. Here I’m going to update that picture slightly in the light of some of the comments I received and then take a look at what sort of diet such a holding would turn out for its inhabitants.
So first the feedback. One general comment I received is that farming is specific: specific to the local soil, the farm’s exact microclimate, and so on – so two different farms are likely to be as similar as ‘chalk and cheese’, to use an appropriately local agricultural cliché.
My response to that is partly to concede the point – here I’m describing a kind of ‘averaged’ or ‘ideal type’ neo-peasant farm, not a blueprint for what any individual farm would necessarily look like in reality.
But my response is also partly to rebut the point: the basic mixed farming package of grass-cereal-legume-ruminant-vegetable-woodland is widely applicable globally, despite numerous local variations.
And the emphasis on local self-provisioning in a neo-peasant world is a further generalising move – the point is not to develop the land to its single most productive specialised use and then create a living from it through extensive monetised trading with other specialists. That’s how we got into this mess in the first place.
The point is to aim towards making a generalised living as best we can from the land around us. So I’d guess that a lot of neo-peasant farms probably would approximate quite closely to the ‘average’ farm I’m describing.
Onto some more specific comments. As I mentioned previously, my assumption of one dairy cow plus calves per hectare was a fairly key one.
Eric from North Carolina, who has considerably more dairying experience than me, suggested that it sounded feasible but possibly somewhat on the high side, while conceding that the grazing in Wessex may be rather better than in his location.
I’m going to try to get a bit of local advice on this issue – though it’s complicated by the fact that not many farmers around here raise house cows without concentrates in the diet.
In the meantime, I’m going to split the difference between my estimate and Eric’s and assume around 3,300 litres of milk per hectare. Eric also picked up on an embarrassing over-estimate in my buttermilk calculations, which
I’ve now corrected. The result is that my neo-peasants get not only less milk, butter and cheese than I’d projected but also less pigs (albeit with a bit more buttermilk and whey for direct consumption).
This makes the nutritional turn-out of the whole thing much tighter than it had been. So thanks a bunch, Eric. But seriously, I want this to be as plausible as possible, so I’m genuinely grateful for the scrutiny.
If I need to make good the deficit arising from Eric’s correction (and I think I probably do) it leaves me with some choices about which under-exploited margin to push. There are three options:
That leaves us with 1.9ha or 19% woodland – still a pretty generous margin, I think, given that less than 5% of UK farmland is wooded currently.
Other comments included the suggestion of barley, which I’ve now included at a yield of 2.25tha-1 for hulled grain instead of my long-straw wheat.
And also a suggestion for sugar beet. Not so sure about that one – but I’m providing for Beta vulgaris in the garden, and I don’t doubt that some wily Wessex neo-peasants would experiment with it and probably achieve better productivity with it overall than I’m projecting in my sugarless neo-peasant world. It was also suggested that geese are garden-raiders that are best avoided.
In my limited experience of goose-keeping, it’s harder keeping the fox from the goose than the goose from the garden, but in any case the geese are a fairly insignificant part of the overall system so I’m not proposing to change that.
There were also some interesting discussions about different ruminant species and the virtues of animal versus vegetable oil. I’ll come on to some of those issues in later posts, but I don’t propose to change my overall approach just now. Thanks to everyone who commented.
So now it’s time to look at the nutritional profile of the neo-peasant diet I’ve projected. For the moment, I’m just going to look at the 10 hectare holding with its 20 residents and consider whether the holding can meet their nutritional needs. Later on, I’ll look at the situation in Wessex as a whole, and beyond.
A complete definition of nutritional adequacy would, I suppose, have to look at the full range of dietary sub-components that nutritionists have identified – all the vitamins, all the minerals etc. This starts to get a bit unwieldy, so what I’ve done here is take the two obvious macro-nutrients that people need – energy and protein – and then four other indicator nutrients, namely Vitamin A, Vitamin C, magnesium and iron.
We then need some baseline figures for how much of these nutrients an individual person needs. This varies by age and gender and doubtless other individual metrics, which again complicates analysis. But since I’m assuming a mix of ages and genders on my hypothetical holding, taking an overall average figure is defensible, I think.
Probably the most controversial decision is how much energy an individual needs. Current government recommendations average out at around 2,000 calories per day (that’s 8,373.6 kilojoules to us metricians). Doubtless it could be argued that a neo-peasant working their holding for food will require more energy than the average desk and car-bound modern westerner.
Indeed, I’ve seen it suggested that peasants of yore consumed as many as 4,000 calories per day, though I haven’t seen that substantiated in the research literature – if anyone has a credible reference for it, I’d appreciate a tip-off.
If that 4,000 calorie figure indeed was true, it’s probably worth remembering that peasants of bygone days were typically working in low crop-yield and low fertility situations, producing large surpluses for their social superiors, and probably walking around a lot in between fragmented holdings.
I’m not sure how valid those assumptions would be if applied to the future neo-peasants of Wessex (at least if it all turns out the way I’m construing it here, which it probably won’t). It does of course partly depend on what other energy sources are available on the holding, a point that I’ll address when I get around to it.
But even if those additional sources are minimal, I think a lot of the working time on the silvo-agri-pastoral holding I described in my previous post would involve only minor exertion, though there’d certainly be some tiring days in the course of the year.
It’s also worth bearing in mind that half the people on the holding are basically uninvolved in its day-to-day work and in view of their age profile are likely to have a sub-2,000 calorific requirement.
Anyway, enough of this waffle. You want me to specify a figure for the assumed average daily calorific needs of all the residents on the Wessex neo-peasant holding? You got it – 2,250 calories. Any problems with that, please dial 1-800-DOYOUROWNDARNEDSPREADSHEET.
I’m hoping that the other nutritional targets require less debate. US government recommendations suggest, on average, about 50g of protein a day, 800mg of Vitamin A (RAE), 80mg of Vitamin C, 400mg of magnesium and 12mg of iron. And it doesn’t do to question what the US government recommends.
I’ve converted the crop yields by kilogram reported in my previous post into values for the nutritional indicators outlined above using food composition tables – mostly those provided by the USDA on this handy website, while occasionally using a borrowed copy of McCance and Widdowson’s venerable The Composition of Foods from the 1970s.
The USDA figures are generally a bit lower than McCance and Widdowson, which suits my taste for under-estimation (though perhaps foods now are just genuinely less nutrient dense than in the 1970s?) The results are summarised in Table 1.
The first line shows how much the 10ha holding described in my previous post would produce annually in total for each of the nutritional indicators described above.
The second line shows how much of these various nutrients would be required by the 20 people on the holding annually on the basis of the recommended intake described above. The third line shows the ratio of these two figures to provide an at-a-glance indicator of whether the holding has hit its targets (so, less than one shows target missed, more than one shows target exceeded).
Table 1: Nutrient Productivity on a Wessex Neo-Peasant Holding
So the answer is…yes the holding does hit its targets, quite comfortably, in all cases, the closest call being with the energy requirement, in which there’s only a 10% surfeit of productivity over need.
Bearing in mind my modest yield assumptions and the many potential margins of productivity that I left unexploited, I think this analysis clearly suggests that it’s not in principle a very difficult thing for people occupying lowland agricultural land in Wessex at a density of about 2 per hectare (or 1 per 1¼ acre) to furnish themselves with their needs.
I probably need to reiterate once again in view of the scoffing that this exercise has already prompted that I’m making no claims here about the ease of creating a future sustainable neo-peasant society along the lines implied in this analysis. What I guess I am claiming is that, so far as we can tell from present circumstances, such a society might in principle be possible.
I’ll conclude this post with a few further breakdowns of the nutritional data. Figure 1 shows the proportionate contribution of the different food types produced on the holding to the energy component of the diet, while Table 2 is a corresponding presentation for the protein component.
Table 2: Energy and protein components of the neo-peasant diet
The figures show a nice, healthy diet, with most of the macro-nutrients from grass-based meat, dairy and vegetables. Fruit also looms quite large, and starchy staples only provide about 10% of the nutrients. So plenty of room to intensify there, should the need arise.
The other nutritional check to run is what I’m calling Proposition Paul – a suggestion from Paul, a pioneering local neo-peasant here in Wessex, that the peasant diet should aim to get about 16% of its calories from protein (max 20%), about 40% from fat (max 48%), and the rest from carbohydrates, preferably of the complex rather than the simple kind. And it turns out that we hit these targets.
Calories from protein are 16.6% and from fat 40.5%. That leaves 43% from carbohydrates all told, and only 7% from simple carbohydrates.
Well, this neo-peasant lifestyle is a breeze, isn’t it? But of course we haven’t yet looked at how the rest of the good people of Wessex will fare. And lurking menacingly in the background is the dark shadow of Londinium…
.
[IB Publisher's note: This article has been updated on September 9th with the addition of Chris Smaje calculations on nutritional yields from the farm he modeled.]
By Chris Smaje on 30 August 2016 for Small Farm Future -
(http://smallfarmfuture.org.uk/?cat=6)
Image above: Photo of the countryside of North Wessex Downs. From (https://fourpointmapping.wordpress.com/2012/10/19/north-wessex-downs-survey/).
[IB Publisher's Note: This article has important information on land area and yields of organic products in the temperate climate of Wessex, England. Metric system measurements are used throughout and will need to be converted for use in the United States (largely because of Ronald Reagan's rejection of modernizing America to the will of rational science. As a result many measurements may not be intuitively understood by readers of this blog. Approximations are:
A litre 'l' is about 2 quarts or a 1/2 gallon.
A millilitre 'ml' is about a fifth of a teaspoon.
A meter 'm' is about a yard.
A square meter 'm2 ' is a about 10 square feet.
A hectare 'ha' is a 1,000 square meters or about 2.5 acres.
A kilogram 'kg' is about 2 pounds.
A tonne 't' is a thousand kilograms, or about 2,000 pounds
A 'tha -1' equals tonnes per hectare, or about 800 pounds per acre.]
Right, no more faffing around. Without further ado, I’m going to describe the layout of an ‘average’ 10 hectare holding in the Peasant’s Republic of Wessex, circa 2039, as introduced in various preceding posts. The holding, remember, has 10 whole-time equivalent workers, and ten dependents (children/elders).
I’m going to play around with those figures in due course, but let’s stick with them for now – so imagine 10 people doing the work implied in what I outline below. As to what energy sources they’ll have available…well, I’ll come to that when I’m ready.
Please shout out if you don’t like any of the numbers I’m about to throw around
1.The structure of the holding
First, I’m going to take out 3.5% or 3,500m2 of the land area on my 10ha holding for houses, outbuildings and tracks.
Each of the five houses on the holding gets their own 250m2 organic vegetable garden, totalling 0.125ha in all.
There’s just under 1.4ha of cropland, farmed organically, which the residents jointly tend.
There’s about 6ha of grass for grazing, comprising about 5ha of permanent pasture, a 0.5ha orchard with fruit and nut trees and grass in between for grazing (the trees may need some protection), and almost 0.5ha of temporary grass/clover ley in the cropland available for grazing.
There’s about 2.5ha of woodland.
2.The cropland
In a real situation, I think people would grow a pretty wide range of crops, a lot of them minor ones occupying small areas. I don’t see it as my job to lay out in exhaustive detail exactly what all these crops might be, so for this exercise I’m restricting the cropping to a relatively small range of fairly obvious crops. I’m interested in any suggestions for refinements, particularly if they come with reasons as to why it’s important to include them.
In relation to crop yields, I have three sources of data. First, my own data back from the days around 2010/11 when I was young and enthusiastic and I could be bothered to keep meticulous cropping records. Second, I have data in the form of a sneak preview from my friend Rebecca Laughton’s fascinating forthcoming study of small farm productivity in the UK.
And finally, I have data from my copy of the 2011/12 Organic Farm Management Handbook. If I get a few more donations to the website I might splash out on a newer version, and update the figures.
In keeping with my preference to err on the side of under-estimating rather than over-estimating yields, in each case I’ve taken whichever of my three data sources reports the lowest average yield. I think the yield per hectare figures I’m assuming generally are on the low side, but I’d welcome any comments.
Other sources of data I’ve used are further referenced below.
One other point: some people like to stress the yield advantages of backyard scale, labour intensive mixed cropping and might therefore think that the yield data I’m using from commercial-scale single-crop systems underestimates the possibilities. I’ve explained here why I’m a bit sceptical about the claims made for mixed cropping. And in any case, as I’ve just said, I don’t mind underestimating a bit.
Where I have made minor allowance for the benefits of small scale is in the issue of edge. I don’t go with the over-mystical enthusiasm for edge associated with the wilder shores of the permaculture movement, but look at it this way: a square 10ha field has a perimeter of 1,265m.
You could sow wheat in the field while establishing around 300 apple trees around the perimeter with essentially no loss of growing space for the wheat.
A cereal farmer with a large number of 10ha fields isn’t going to do that. But 10 neo-peasants living in a 10ha field probably are. So in that way we can increase the effective growing area of the field using nothing but the magic of human labour and linear planting, so long as we don’t push that logic too far…
OK, so let’s look at what’s in the shared cropland. First up, I’m going to set aside about 350m2 to grow hemp and flax in order to make clothes. Personally I prefer wearing cotton and synthetic fibres and would probably be willing to spend some of my off-farm household income on that if it wasn’t too expensive, but let’s go with the home-grown option.
I’ve taken figures for hemp and flax from Simon Fairlie’s ‘Can Britain feed itself?’1 – it amounts to about 7kg of fibre per person per year.
The rest of the cropland is split into an eight course rotation, each course occupying just under 1,700m2. The rotation I envisage is as follows (though not necessarily in this chronological sequence):
- Grass/clover ley (available for ruminant grazing)
- Grass/clover ley
- Potatoes, split between earlies yielding 6.4 tonnes per hectare (25%) and maincrop yielding 12.7 tha-1 (75%)
- A short-straw spring wheat, yielding 3.5 tha-1
- A long-straw, traditional variety winter wheat with low fertility requirements, yielding 1.75 tha-1
- Legumes, split 50/50 between broad beans for the summer and drying beans for the winter (both 2.5 tha-1)
- Vegetables: split between cabbages (75%) yielding 35 tha-1 and swede (25%) yielding 24 tha-1.
- Vegetables: a third each of onions (19 tha-1), leeks (11 tha-1) and carrots (35 tha-1)
Wheat’s co-product, straw, would be in high demand around the holding – one reason for growing a traditional long-straw variety, as suggested by Michael under a previous post.
Yield figures for potatoes, wheat and legumes are further corrected for seed input. The other crops aren’t corrected, on the grounds that it’s fairly negligible.
3.The Garden
In the garden, I’m projecting seven crops, though in reality there’d be more:
- Espalier apple on the south-facing edge: just over 3 trees on average in each of the 5 gardens, yielding 9kg of apples per tree.
- Tomatoes: 30 plants per garden yielding 2kg per plant
- Strawberries: about 80m2 yielding 6.3 tha-1
- Chard: about 40m2 yielding 30.5 tha-1 (cut and come again)
- Courgettes: about 40m2 yielding 40.8 tha-1
- Lettuce: about 40m2 yielding 3.3 tha-1
- Kale: about 40m2 yielding 35.7 tha-1
4.The Orchard
In a 0.5 ha orchard, I think there would be space for:
- 56 apple trees on MM106 rootstocks, producing about 26kg per tree
- 47 pear trees on Quince A rootstocks, producing about 17kg per tree
- 58 plum trees on St Julien A rootstocks, producing about 12kg per tree
- 47 hazel bushes, producing about 3kg per tree
5.Livestock and Meat
(i) Cows
I have little experience of dairying, so I’m a bit uncertain of these figures and would welcome any comments. But the most efficient way of getting useful human food from grass is via a dairy cow, so there will be cows on my holding.
These will be more or less pure grass-fed house cows, not souped up (or at least soya and cerealed-up) champion milkers of the modern kind. They will have preferential access to the clover-rich leys on the cropland and will otherwise be part of a grazing rotation over the permanent pasture.
I’m assuming 1 ha of grazing will feed a cow and her calves over the year, and yield 4,000 litres of milk, plus 90kg of meat per hectare per year from the calf (slaughtered at 2 years, and with some kept as cow replacements after 10 years).
There’d probably be a need for careful pasture management (and maybe occasional reseeding?) to ensure a relatively high-productivity pasture (white clover, perennial ryegrass etc.)
There would be 3 house cows on the holding. About a fifth of their milk would be kept for direct human consumption, which works out at about 300ml per day for each of the 20 people on the holding.
he rest of the milk would be turned into butter and cheese. I’m assuming about half of it will be devoted to butter, with 20 litres of milk producing 1kg of butter (I’m anxious that my neo-peasants have enough fat to eat and to cook with).
And just under a third is devoted to cheese, with 8 litres of milk going into each kg of cheese. The butter and cheese-making processes give the co-products of buttermilk and whey respectively (90l of buttermilk per 100l of milk for butter, and 87l of whey per 100l of milk for cheese). A little bit of this will be eaten directly by the people on the holding, but most of it will be used to feed pigs (see below).
(ii) Sheep
I’m assuming that a hectare of permanent pasture could support 6 ewes plus their lambs (and a ram, or part thereof) year round. I think that’s a pretty low estimate, but it provides a bit of extra margin for the cows.
The sheep would be on just under 3 ha of the permanent pasture, and there would be about 18 ewes in all, each producing 1.5 lambs annually on average. Ewes would be culled on average at five years, with lambs raised to replace them.
On the basis of those assumptions, the sheep would produce 544kg of meat (lamb and mutton) per year, plus some wool and other bits and pieces which would doubtless come in handy. Rotating them around the pasture with the cows would help to keep the worm burden down.
(iii) Pigs
I’ll start with the assumption that I can raise two pigs in the woodland. I know this is cheating a bit, but I’ll have a clearing in the woodland in which I can grow some clover and fodder beet for them. They’ll also get to eat waste material from the gardens and kitchens (there’s no swill ban in the Peasant’s Republic of Wessex).
This is pretty much what I do now, and I reckon I could easily raise two almost-default pigs this way. But I’m worried that my neo-peasants aren’t going to have enough easily available fat, so I’d like to raise some more pigs.
If I reserve all but 5% of the buttermilk and whey from the dairy as pig food, and on the assumption that you have to put about six times more energy into a pig than you get out, I reckon I can raise another four pigs from the dairy.
I think there’ll also be a bit of a surplus of potatoes and beans from the field crops, so I’m going to devote something like 650kg of the potato crop and 150kg of the bean crop to pig food, getting an extra three pigs. And that should give us about 400kg of pig meat per year altogether (I’m assuming smaller, leaner pigs at slaughter than the current commercial norm – killing out at 44kg, which was the weight of my default-raised Tamworths last year).
We should be able to get a good few kilos of lard out of the pig meat (and a little more from the beef) which, together with the butter, will be our cooking fat. Having nine pigs in the woodland may trash the ground a bit, but on the basis of my current pig-keeping experiments I think it’d probably be
OK – the average holding would just be raising weaners during the warmer months, which limits the damage.
(iv) Ducks and/or hens
Personally I prefer ducks to hens – better for eating slugs, the No.1 garden pest in Wessex. Though hens are better with some of the insect pests. And ducks’ waddling is less destructive of the ground than chickens’ scratching.
And since I don’t have a TV or young children, ducks are also better at the slapstick humour otherwise missing from my life. But, ducks or hens, my assumptions are basically the same – I’ll have ten of them, each laying on average 285 eggs per year, and requiring about 10kg of feed a week.
Half of that will come from their foraging free-range – well, not entirely free-range, but probably a lot more free-range than the ‘free-range’ products in the shops. The other half will come from the wheat. Talking of free-range, that reminds me that at some point I need to discuss fencing. But not right now.
At the end of their laying lives I guess I’d put the ducks and/or hens in the pot. But the amount of meat isn’t much to write home about, so I’ll ignore it. Meat hens/ducks of course are an option, but a less efficient one. I’m not including any here.
(v) Geese
There’ll be five geese, to be eaten at Christmas, or solstice, or whatever Dionysian rites there are in 2039 to keep the winter blues at bay. The geese will fight it out with the cows and sheep for grazing during the year.
(vi) Bees
There’ll be bees, helping with pollination as well as providing honey, wax, propolis etc. But I don’t think there’ll be much honey, because they need it more than us and we won’t be poisoning them with sugar. So let us say we’ll have just 10kg each year to put by for a rainy day.
(vii) Fish
Fish are efficient converters of fish-food into human-food, and before we became habituated to sea-fish and salmonids, fishponds were a ubiquitous part of the farmed British landscape. I’m sure that there would be neo-peasant fish farmers in Wessex. But most fish farming systems I’ve seen are high input as well as high output and quite energy/building intensive, so I really have no idea how to make realistic estimates.
Therefore I’m going to ignore farmed fish. Likewise with wild freshwater fish. I’m sure people in Wessex would fish in its lakes and rivers, though with so many people around they’d have to be careful not to fish them all out. So I’m going to leave freshwater fish as another under-exploited margin in my analysis.
Sea-fish, on the other hand, seems like a margin worth exploring, given the historic importance of fishing in Wessex, the hundreds of miles of coastline, and the nutritional excellence of wild fish. But it’s a bit tricky coming up with an estimate of sustainable catch.
And perhaps also thinking about fishing technology in a potentially energy-constrained future – though, more than with most things, perhaps the sun, wind and brine of the maritime environment suggests ways that it could be done using mostly renewable inputs.
I confess that I was fairly ignorant about the UK fishing industry until I obtained a copy of the UK Sea Fisheries Statistics and achieved instant enlightenment. Did you know, for example, that 418,000 tonnes of pelagic fish were landed by UK vessels using demersal trawl/seine gear in 2014? Seriously? Well do try to keep up.
I thought long and hard about how best to convert current catch statistics into something that seemed likely to be sustainable. In the end, I plumped for the simple expedient of limiting the catch to that which is currently brought in by UK boats of under 24m, constituting a mere 25% of their total catch. Allocated out on a per capita basis that gives everyone about 2½kg of fish per year each.
My friend Paul has used a more elaborate methodology, looking at estimated sustainable fish stocks from the European Atlas of the Seas, applying it to fishery zones of the western seaboard and allocating it out accordingly to the people of Wessex.
He comes up with the much larger figure of 36½kg of fish per person per year (doubtless my figures are biased towards the considerably smaller onshore fishery while his include more distant offshore fisheries).
I propose in time-honoured fashion to split the difference, giving my neo-peasants 19½ kg of fish each per year. This, incidentally, is the only source of food they get from off the holding.
(viii) Meat – A Summary
The holding’s pastures drive its meat productivity, particularly through the medium of its dairy cows. So my assumption of 1 cow plus calves per hectare is key.
I hope it sounds reasonable. To put it into context, in his ‘restoration agriculture’ system, Mark Shepard proposes to produce just under 20,000 litres of milk and just over 1,200kg of meat from one hectare of his Wisconsin farm2, something that elsewhere I’ve suggested seems implausibly optimisitc3.
Here, I’m proposing to produce 4,000 litres of milk and 168kg of meat from one hectare of a Wessex neo-peasant farm. I guess you could call Wessex the Wisconsin of England, only with a few more people and a few less lakes. And, apparently, a lot less meat and milk.
6.Other Food
It shouldn’t be hard to produce 15kg of fresh shiitake mushrooms on logs cut from the woodland each year.
And it shouldn’t be hard for the kids to harvest 10kg of blackberries from the woodland and hedges, along with 10kg of sea buckthorn berries that will have been strategically planted along one of the holding’s many edges.
In fact, there’s huge scope for growing a lot more in the way of fruit and nuts along these edges, but I’ll leave things at that low level to create another underexploited margin.
I’m not convinced that there’s all that much scope for bushmeat from the holding. I doubt many people will be raising game birds in the Peasant’s Republic of Wessex (there’s no Duchy of Cornwall, remember), so that pretty much leaves us with deer, squirrels, rabbits and pigeons.
Usually, I find it more trouble than it’s worth to go after these creatures, though sometimes either luck or fury at their crop depredations brings some of their meat to my table.
Teenagers with guns around the place can help – though remember there’s 20 people in every 10 hectares, so if you’ve got a rifle make sure you aim it downwards. Anyway, I’m estimating a parsimonious 4kg of bushmeat per holding per year.
Doubtless there’s some scope for collecting wild plants and mushrooms, and for developing invertebrate farming with good input/output ratios (mussels, snails, insects etc.) But again I’m going to leave all that as an unexploited margin.
References
- Fairlie, S. 2007/8. ‘Can Britain feed itself?’ The Land, 4, 18-26.
- Shepard, M. 2013. Restoration Agriculture, Acres USA.
Nutrition yield in neo-peasant Wessex
SUBHEAD: Quantifying nutritional yield from our Neo-peasant Wessex farm model. Two people per hectare works.
By Chris Smaje on 9 September 2016 for Small Farm Future -
(http://smallfarmfuture.org.uk/?p=1074)
Image above: Painting of English peasants reaping grain by George Clausen. From (http://thedeliberateagrarian.blogspot.com/2014/03/the-english-peasant-art-of-sir-george_9.html).
In my last post I presented a picture of the production on an ‘average’ 10 hectare holding in the future Peasant’s Republic of Wessex. Here I’m going to update that picture slightly in the light of some of the comments I received and then take a look at what sort of diet such a holding would turn out for its inhabitants.
So first the feedback. One general comment I received is that farming is specific: specific to the local soil, the farm’s exact microclimate, and so on – so two different farms are likely to be as similar as ‘chalk and cheese’, to use an appropriately local agricultural cliché.
My response to that is partly to concede the point – here I’m describing a kind of ‘averaged’ or ‘ideal type’ neo-peasant farm, not a blueprint for what any individual farm would necessarily look like in reality.
But my response is also partly to rebut the point: the basic mixed farming package of grass-cereal-legume-ruminant-vegetable-woodland is widely applicable globally, despite numerous local variations.
And the emphasis on local self-provisioning in a neo-peasant world is a further generalising move – the point is not to develop the land to its single most productive specialised use and then create a living from it through extensive monetised trading with other specialists. That’s how we got into this mess in the first place.
The point is to aim towards making a generalised living as best we can from the land around us. So I’d guess that a lot of neo-peasant farms probably would approximate quite closely to the ‘average’ farm I’m describing.
Onto some more specific comments. As I mentioned previously, my assumption of one dairy cow plus calves per hectare was a fairly key one.
Eric from North Carolina, who has considerably more dairying experience than me, suggested that it sounded feasible but possibly somewhat on the high side, while conceding that the grazing in Wessex may be rather better than in his location.
I’m going to try to get a bit of local advice on this issue – though it’s complicated by the fact that not many farmers around here raise house cows without concentrates in the diet.
In the meantime, I’m going to split the difference between my estimate and Eric’s and assume around 3,300 litres of milk per hectare. Eric also picked up on an embarrassing over-estimate in my buttermilk calculations, which
I’ve now corrected. The result is that my neo-peasants get not only less milk, butter and cheese than I’d projected but also less pigs (albeit with a bit more buttermilk and whey for direct consumption).
This makes the nutritional turn-out of the whole thing much tighter than it had been. So thanks a bunch, Eric. But seriously, I want this to be as plausible as possible, so I’m genuinely grateful for the scrutiny.
If I need to make good the deficit arising from Eric’s correction (and I think I probably do) it leaves me with some choices about which under-exploited margin to push. There are three options:
- More cropland (or more starchy staples within the cropland)
- More fruit, nuts etc. by pushing at the productivity of the edges
- More pasture, at the expense of woodland
That leaves us with 1.9ha or 19% woodland – still a pretty generous margin, I think, given that less than 5% of UK farmland is wooded currently.
Other comments included the suggestion of barley, which I’ve now included at a yield of 2.25tha-1 for hulled grain instead of my long-straw wheat.
And also a suggestion for sugar beet. Not so sure about that one – but I’m providing for Beta vulgaris in the garden, and I don’t doubt that some wily Wessex neo-peasants would experiment with it and probably achieve better productivity with it overall than I’m projecting in my sugarless neo-peasant world. It was also suggested that geese are garden-raiders that are best avoided.
In my limited experience of goose-keeping, it’s harder keeping the fox from the goose than the goose from the garden, but in any case the geese are a fairly insignificant part of the overall system so I’m not proposing to change that.
There were also some interesting discussions about different ruminant species and the virtues of animal versus vegetable oil. I’ll come on to some of those issues in later posts, but I don’t propose to change my overall approach just now. Thanks to everyone who commented.
So now it’s time to look at the nutritional profile of the neo-peasant diet I’ve projected. For the moment, I’m just going to look at the 10 hectare holding with its 20 residents and consider whether the holding can meet their nutritional needs. Later on, I’ll look at the situation in Wessex as a whole, and beyond.
A complete definition of nutritional adequacy would, I suppose, have to look at the full range of dietary sub-components that nutritionists have identified – all the vitamins, all the minerals etc. This starts to get a bit unwieldy, so what I’ve done here is take the two obvious macro-nutrients that people need – energy and protein – and then four other indicator nutrients, namely Vitamin A, Vitamin C, magnesium and iron.
We then need some baseline figures for how much of these nutrients an individual person needs. This varies by age and gender and doubtless other individual metrics, which again complicates analysis. But since I’m assuming a mix of ages and genders on my hypothetical holding, taking an overall average figure is defensible, I think.
Probably the most controversial decision is how much energy an individual needs. Current government recommendations average out at around 2,000 calories per day (that’s 8,373.6 kilojoules to us metricians). Doubtless it could be argued that a neo-peasant working their holding for food will require more energy than the average desk and car-bound modern westerner.
Indeed, I’ve seen it suggested that peasants of yore consumed as many as 4,000 calories per day, though I haven’t seen that substantiated in the research literature – if anyone has a credible reference for it, I’d appreciate a tip-off.
If that 4,000 calorie figure indeed was true, it’s probably worth remembering that peasants of bygone days were typically working in low crop-yield and low fertility situations, producing large surpluses for their social superiors, and probably walking around a lot in between fragmented holdings.
I’m not sure how valid those assumptions would be if applied to the future neo-peasants of Wessex (at least if it all turns out the way I’m construing it here, which it probably won’t). It does of course partly depend on what other energy sources are available on the holding, a point that I’ll address when I get around to it.
But even if those additional sources are minimal, I think a lot of the working time on the silvo-agri-pastoral holding I described in my previous post would involve only minor exertion, though there’d certainly be some tiring days in the course of the year.
It’s also worth bearing in mind that half the people on the holding are basically uninvolved in its day-to-day work and in view of their age profile are likely to have a sub-2,000 calorific requirement.
Anyway, enough of this waffle. You want me to specify a figure for the assumed average daily calorific needs of all the residents on the Wessex neo-peasant holding? You got it – 2,250 calories. Any problems with that, please dial 1-800-DOYOUROWNDARNEDSPREADSHEET.
I’m hoping that the other nutritional targets require less debate. US government recommendations suggest, on average, about 50g of protein a day, 800mg of Vitamin A (RAE), 80mg of Vitamin C, 400mg of magnesium and 12mg of iron. And it doesn’t do to question what the US government recommends.
I’ve converted the crop yields by kilogram reported in my previous post into values for the nutritional indicators outlined above using food composition tables – mostly those provided by the USDA on this handy website, while occasionally using a borrowed copy of McCance and Widdowson’s venerable The Composition of Foods from the 1970s.
The USDA figures are generally a bit lower than McCance and Widdowson, which suits my taste for under-estimation (though perhaps foods now are just genuinely less nutrient dense than in the 1970s?) The results are summarised in Table 1.
The first line shows how much the 10ha holding described in my previous post would produce annually in total for each of the nutritional indicators described above.
The second line shows how much of these various nutrients would be required by the 20 people on the holding annually on the basis of the recommended intake described above. The third line shows the ratio of these two figures to provide an at-a-glance indicator of whether the holding has hit its targets (so, less than one shows target missed, more than one shows target exceeded).
Table 1: Nutrient Productivity on a Wessex Neo-Peasant Holding
| X103 | Energy (KJ) | Protein (g) | Vitamin A (mg) | Viitamin C (mg) | Mg (mg) | Fe (mg) |
| Produced | 75,617 | 791 | 29,367 | 3,635 | 5,241 | 125 |
| Required | 68,593 | 364 | 5,825 | 582 | 2,913 | 87 |
| Ratio | 1.10 | 2.17 | 5.04 | 6.24 | 1.80 | 1.43 |
So the answer is…yes the holding does hit its targets, quite comfortably, in all cases, the closest call being with the energy requirement, in which there’s only a 10% surfeit of productivity over need.
Bearing in mind my modest yield assumptions and the many potential margins of productivity that I left unexploited, I think this analysis clearly suggests that it’s not in principle a very difficult thing for people occupying lowland agricultural land in Wessex at a density of about 2 per hectare (or 1 per 1¼ acre) to furnish themselves with their needs.
I probably need to reiterate once again in view of the scoffing that this exercise has already prompted that I’m making no claims here about the ease of creating a future sustainable neo-peasant society along the lines implied in this analysis. What I guess I am claiming is that, so far as we can tell from present circumstances, such a society might in principle be possible.
I’ll conclude this post with a few further breakdowns of the nutritional data. Figure 1 shows the proportionate contribution of the different food types produced on the holding to the energy component of the diet, while Table 2 is a corresponding presentation for the protein component.
Table 2: Energy and protein components of the neo-peasant diet
| Proportion of Food Energy Intake (%) | Proportion of Protein Intake (%) | |
| Potatoes, wheat & barley | 14 | 10 |
| Legumes | 1 | 2 |
| Vegetables | 21 | 25 |
| Fruit & nuts | 10 | 2 |
| Dairy | 27 | 27 |
| Meat | 21 | 22 |
| Fish | 4 | 9 |
| Other | 1 | 2 |
The figures show a nice, healthy diet, with most of the macro-nutrients from grass-based meat, dairy and vegetables. Fruit also looms quite large, and starchy staples only provide about 10% of the nutrients. So plenty of room to intensify there, should the need arise.
The other nutritional check to run is what I’m calling Proposition Paul – a suggestion from Paul, a pioneering local neo-peasant here in Wessex, that the peasant diet should aim to get about 16% of its calories from protein (max 20%), about 40% from fat (max 48%), and the rest from carbohydrates, preferably of the complex rather than the simple kind. And it turns out that we hit these targets.
Calories from protein are 16.6% and from fat 40.5%. That leaves 43% from carbohydrates all told, and only 7% from simple carbohydrates.
Well, this neo-peasant lifestyle is a breeze, isn’t it? But of course we haven’t yet looked at how the rest of the good people of Wessex will fare. And lurking menacingly in the background is the dark shadow of Londinium…
.
No comments :
Post a Comment