SUBHEAD: Breathtaking animation of the Moon's rotation and a Space Station view of Earth time lapse.
By David Pescovitz on 17 September 2013 for Boing Boing -
(http://www.youtube.com/watch?v=FG0fTKAqZ5g)
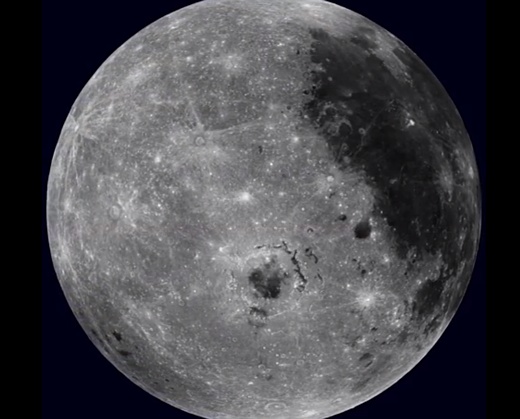
Image above: A Forever full moon. From (http://boingboing.net/2013/09/17/breathtaking-video-of-the-moon.html).
This stunning animation of the Moon's rotation was made from images captured by NASA's Lunar Reconissance Orbiter's Wide Angle Camera (WAC). "A Unique View of the Moon" (Arizona State University)
Video above: An otherwise unavailable view of moon rotating. From (http://youtu.be/sNUNB6CMnE8).
From (http://lroc.sese.asu.edu/news/index.php?/archives/790-A-Unique-View-Of-The-Moon.html)
A huge payoff from the longevity of the LRO mission is the repeat coverage obtained by the LROC Wide Angle Camera (WAC). The WAC has a very wide field-of-view (FOV), 90° in monochrome mode and 60° in multispectral mode, hence its name. On the one hand, the wide FOV enables orbit-to-orbit stereo, which allowed LROC team members at the DLR to create the unprecedented 100 meter scale near-global (0° to 360° longitude and 80°S to 80°N latitude) topographic map of the Moon (the GLD100)!
However, the wide FOV also poses challenges for mosaicking and reconstructing lunar colors because the perspective changes plus- and minus-30° from the center to the edges of each frame. The problem lies in the fact that the perceived reflectance of the Moon changes as the view angle changes.
So for the WAC, the surface appears to be most reflective in the center of the image and less so at the edges, which is quite distracting! This effect results in a pole-to-pole striped image when making a "not-corrected" mosaic.
What to do? Easy - simply take 36 nearly complete global mosaics (110,000 WAC images) and determine an equation that describes how changes in Sun angle and view angle result in reflectance changes. Next step, for each pixel in those 110,000 WAC images compute the Solar angle and the viewpoint angle (using the GLD100 to correct for local slopes), and adjust the measured brightness to common angles everywhere on the Moon.
For this mosaic the LROC Team used the 643 nm band, a Solar angle 10° from vertical (nearly noon), and a viewing angle straight down. Well, perhaps easy is a bit of an exaggeration!
Imagine the number of pixels to consider! To reduce the computational load we use only a subset of the pixels to fit. The most challenging aspect is determining the best photometric model for this huge dataset. Using existing knowledge of lunar reflectance, many iterations, and a variety of classes of mathematical solutions, we ended up using a combination of output from a least-squares fit on a linear model as starting parameters to a minimum search algorithm on a non-linear model. This technique adds robustness to the non-linear model and enables us to more quickly converge on a solution.
Or in other words, there were a lot of calculations over many starts and restarts. So perhaps the process was not that easy in practice, but in the end, it was successful! This type of study is known as photometry, and has a rich history going back to the first half of the 20th century.
Space Station Time Lapse
By David Peterson on 6 October 2011 for YouTube -
(http://www.youtube.com/watch?v=FG0fTKAqZ5g)
Inspired by a version of the opening sequence of this clip called 'What does it feel like to fly over planet Earth?', I tracked down the original time-lapse sequence taken on the International Space Station (ISS) via NASA, found some additional ones there, including the spectacular Aurora Australis sequences, and set it to a soundtrack that almost matches the awe and wonder I feel when I see our home from above.
[IB Publisher's note: The white flashes in the clouds are lightning flashes.]
Video above: From (http://youtu.be/FG0fTKAqZ5g).
.
By David Pescovitz on 17 September 2013 for Boing Boing -
(http://www.youtube.com/watch?v=FG0fTKAqZ5g)
Image above: A Forever full moon. From (http://boingboing.net/2013/09/17/breathtaking-video-of-the-moon.html).
This stunning animation of the Moon's rotation was made from images captured by NASA's Lunar Reconissance Orbiter's Wide Angle Camera (WAC). "A Unique View of the Moon" (Arizona State University)
Video above: An otherwise unavailable view of moon rotating. From (http://youtu.be/sNUNB6CMnE8).
From (http://lroc.sese.asu.edu/news/index.php?/archives/790-A-Unique-View-Of-The-Moon.html)
A huge payoff from the longevity of the LRO mission is the repeat coverage obtained by the LROC Wide Angle Camera (WAC). The WAC has a very wide field-of-view (FOV), 90° in monochrome mode and 60° in multispectral mode, hence its name. On the one hand, the wide FOV enables orbit-to-orbit stereo, which allowed LROC team members at the DLR to create the unprecedented 100 meter scale near-global (0° to 360° longitude and 80°S to 80°N latitude) topographic map of the Moon (the GLD100)!
However, the wide FOV also poses challenges for mosaicking and reconstructing lunar colors because the perspective changes plus- and minus-30° from the center to the edges of each frame. The problem lies in the fact that the perceived reflectance of the Moon changes as the view angle changes.
So for the WAC, the surface appears to be most reflective in the center of the image and less so at the edges, which is quite distracting! This effect results in a pole-to-pole striped image when making a "not-corrected" mosaic.
What to do? Easy - simply take 36 nearly complete global mosaics (110,000 WAC images) and determine an equation that describes how changes in Sun angle and view angle result in reflectance changes. Next step, for each pixel in those 110,000 WAC images compute the Solar angle and the viewpoint angle (using the GLD100 to correct for local slopes), and adjust the measured brightness to common angles everywhere on the Moon.
For this mosaic the LROC Team used the 643 nm band, a Solar angle 10° from vertical (nearly noon), and a viewing angle straight down. Well, perhaps easy is a bit of an exaggeration!
Imagine the number of pixels to consider! To reduce the computational load we use only a subset of the pixels to fit. The most challenging aspect is determining the best photometric model for this huge dataset. Using existing knowledge of lunar reflectance, many iterations, and a variety of classes of mathematical solutions, we ended up using a combination of output from a least-squares fit on a linear model as starting parameters to a minimum search algorithm on a non-linear model. This technique adds robustness to the non-linear model and enables us to more quickly converge on a solution.
Or in other words, there were a lot of calculations over many starts and restarts. So perhaps the process was not that easy in practice, but in the end, it was successful! This type of study is known as photometry, and has a rich history going back to the first half of the 20th century.
Space Station Time Lapse
By David Peterson on 6 October 2011 for YouTube -
(http://www.youtube.com/watch?v=FG0fTKAqZ5g)
Inspired by a version of the opening sequence of this clip called 'What does it feel like to fly over planet Earth?', I tracked down the original time-lapse sequence taken on the International Space Station (ISS) via NASA, found some additional ones there, including the spectacular Aurora Australis sequences, and set it to a soundtrack that almost matches the awe and wonder I feel when I see our home from above.
[IB Publisher's note: The white flashes in the clouds are lightning flashes.]
Video above: From (http://youtu.be/FG0fTKAqZ5g).
.
No comments :
Post a Comment