SUBHEAD: An examination into how hard, sustainable and affordable it is to power your own site.
By Kris De Decker on 1 February 2020 for Low Tech Magazine -
(https://www.lowtechmagazine.com/2020/01/how-sustainable-is-a-solar-powered-website.html)
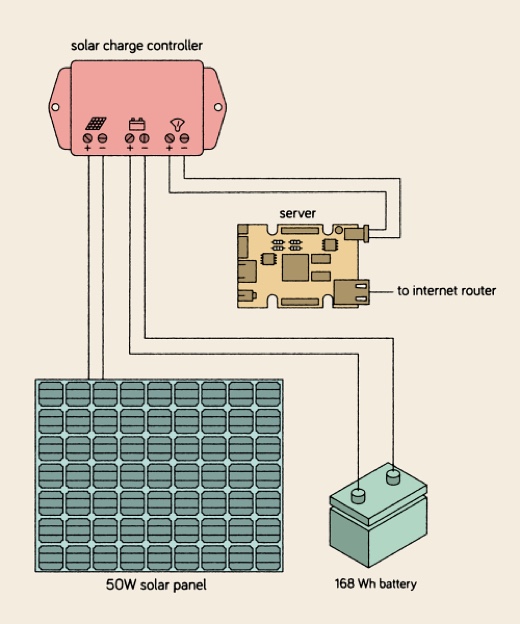
Image above: Diagram of home solar powered website. From original article. A simple representation of the system. A charge controller powered by a 50w solar panel charges a 168wh battery that runs a server to an internet router. The voltage conversion (between the 12V charge controller and the 5V server) and the battery meter (between the server and the battery) are missing.
(IB Editor's note: I just checked Amazon. A solar charge controller that meets the needs of this home base powered website server costs $10.97 with free Prime shipping. See (https://www.amazon.com/EEEKit-Controller-Intelligent-Multi-Function-Adjustable/dp/B07R8TRJ8C). I've had one for years attached to four 110ah dee cycle marine batteries keeping the LED lighting on in my shop. I think I paid over $30 for it then.)
.
Introduction
In September 2018, Low-tech Magazine launched a new website that aimed to radically reduce the energy use and carbon emissions associated with accessing its content. Internet energy use is growing quickly on account of both increasing bit rates (online content gets “heavier”) and increased time spent online (especially since the arrival of mobile computing and wireless internet).
The solar powered website bucks against these trends. To drop energy use far below that of the average website, we opted for a back-to-basics web design, using a static website instead of a database driven content management system. To reduce the energy use associated with the production of the solar panel and the battery, we chose a minimal set-up and accepted that the website goes off-line when the weather is bad.
We have been monitoring the solar powered server for 15 months now, and we have collected data on uptime, energy use, power use, system efficiency, and visitor traffic. We also calculated how much energy was required to make the solar panel, the battery, the charge controller and the server.
Uptime, Electricity Use & System Efficiency
The solar powered website goes off-line when the weather is bad – but how often does that happen? For a period of about one year (351 days, from 12 December 2018 to 28 November 2019), we achieved an uptime of 95.26%. This means that we were off-line due to bad weather for 399 hours.
If we ignore the last two months, our uptime was 98.2%, with a downtime of only 152 hours. Uptime plummeted to 80% during the last two months, when a software upgrade increased the energy use of the server. This knocked the website off-line for at least a few hours every night.
Let’s have a look at the electricity used by our web server (the “operational” energy use). We have measurements from the server and from the solar charge controller. Comparing both values reveals the inefficiencies in the system. Over a period of roughly one year (from 3 December 2018 to 24 November 2019), the electricity use of our server was 9.53 kilowatt-hours (kWh).
We measured significant losses in the solar PV system due to voltage conversions and charge/discharge losses in the battery. The solar charge controller showed a yearly electricity use of 18.10 kWh, meaning that system efficiency was roughly 50%.
During the period under study, the solar powered website received 865,000 unique visitors. Including all energy losses in the solar set-up, electricity use per unique visitor is then 0.021 watt-hour. One kilowatt-hour of solar generated electricity can thus serve almost 50,000 unique visitors, and one watt-hour of electricity can serve roughly 50 unique visitors. This is all renewable energy and as such there are no direct associated carbon emissions.
There is no such omission with a self-hosted website powered by an off-the-grid solar PV installation. The solar panel, the battery, and the solar charge controller are equally essential parts of the installation as the server itself. Consequently, energy use for the mining of the resources and the manufacture of these components – the “embodied energy” – must also be taken into account.
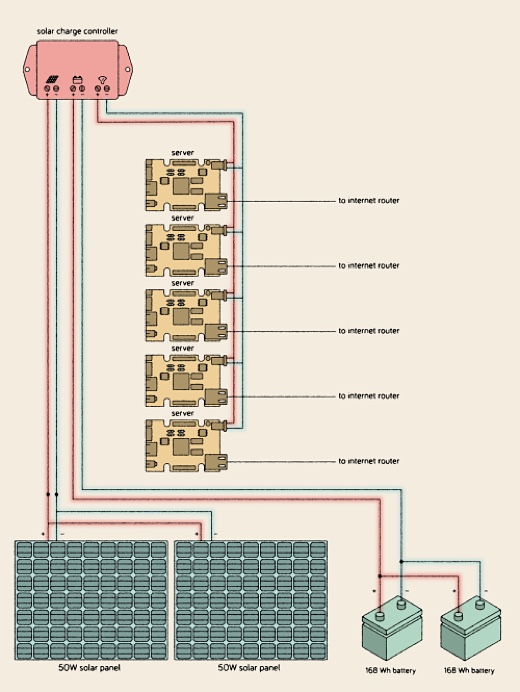
Image above: Diagram of five servers powrf two 168wh batteries charged by two 50w solar panels a charge controller powered by two 50watt solar panels that charge two 168wh batteries.
Unfortunately, most of this energy comes from fossil fuels, either in the form of diesel (mining the raw materials and transporting the components) or in the form of electricity generated mainly by fossil fuel power plants (most manufacturing processes).
The embodied energy of our configuration is mainly determined by the size of the battery and the solar panel. At the same time, the size of battery and solar panel determine how often the website will be online (the “uptime”). Consequently, the sizing of battery and solar panel is a compromise between uptime and sustainability.
To find the optimal balance, we have run (and keep running) our system with different combinations of solar panels and batteries. Uptime and embodied energy are also determined by the local weather conditions, so the results we present here are only valid for our location (the balcony of the author’s home near Barcelona, Spain).
Greater than 90% Uptime
First, let’s calculate the minimum energy storage needed to keep the website online during the night, provided that the weather is good, the battery is new, and the solar panel is large enough to charge the battery completely. The average power use of our web server during the first year, including all energy losses in the solar installation, was 1.97 watts. During the shortest night of the year (8h50, June 21), we need 17.40 watt-hour of storage capacity, and during the longest night of the year (14h49, December 21), we need 29.19 Wh.
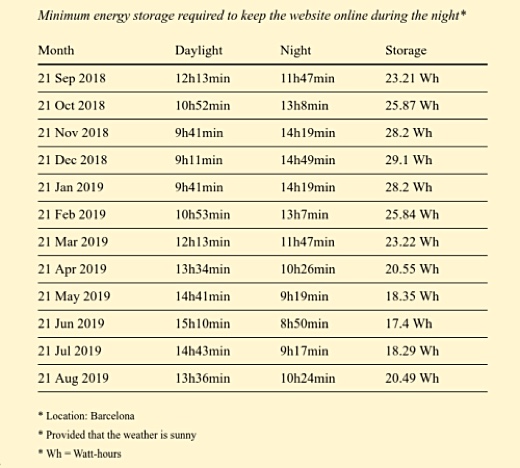
Table 1: Minimum energy required to keep website on line during the night. From original article.
Because lead-acid batteries should not be discharged below half of their capacity, the solar powered server requires a 60 Wh lead-acid battery to get through the shortest nights when solar conditions are optimal (2 x 29.19Wh). For most of the year we ran the system with a slightly larger energy storage (up to 86.4 Wh) and a 50W solar panel, and achieved the above mentioned uptime of 95-98%. [1]
100% Uptime
A larger battery would keep the website running even during longer periods of bad weather, again provided that the solar panel is large enough to charge the battery completely. To compensate for each day of very bad weather (no significant power production), we need 47.28 watt-hour (24h x 1.97 watts) of storage capacity.
From 1 December 2019 to 12 January 2020, we combined the 50 W solar panel with a 168 watt-hour battery, which has a practical storage capacity of 84 watt-hour. This is enough storage to keep the website running for two nights and a day. Even though we tested this configuration during the darkest period of the year, we had relatively nice weather and achieved an uptime of 100%.
However, to assure an uptime of 100% over a period of years would require more energy storage. To keep the website online during four days of low or no power production, we would need a 440 watt-hour lead-acid battery – the size of a car battery. We include this configuration to represent the conventional approach to off-grid solar power.
We also made calculations for batteries that aren’t large enough to get the website through the shortest night of the year: 48 Wh, 24 Wh, and 15.6 Wh (with practical storage capacities of 24 Wh, 12 Wh, and 7.8 Wh, respectively). The latter is the smallest lead-acid battery commercially available.
If the weather is good, the 48 Wh lead-acid battery will keep the server running during the night from March to September. The 24 Wh lead acid-battery can keep the website online for a maximum of 6 hours, meaning that the server will go off-line each night of the year, although at different hours depending on the season.
Finally, the 15.6 Wh battery keeps the website online for only four hours when there’s no solar power. Even if the weather is good, the server will stop working around 1 am in summer and around 9 pm in winter. The maximum uptime for the smallest battery would be around 50%, and in practice it will be lower due to clouds and rain.
A website that goes off-line in evening could be an interesting option for a local online publication with low anticipated traffic after midnight. However, since Low-tech Magazine’s readership is almost equally divided between Europe and the USA this is not an attractive option. If the website goes down every night, our American readers could only access it during the morning.
Uptime and Solar Panel Size
The uptime of the solar powered website is not only determined by the battery, but also by the solar panel, especially in relation to bad weather. The larger the solar panel, the quicker it will charge the battery and fewer hours of sun will be needed to get the website through the night. For example, with the 50 W solar panel, one to two hours of full sun are sufficient to completely charge any of the batteries (except for the car battery).
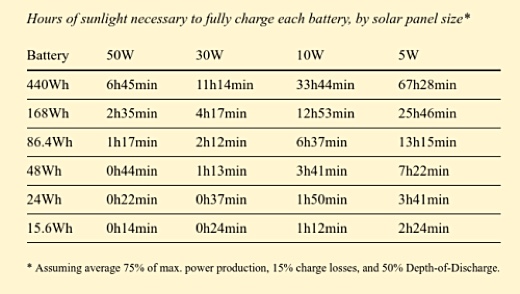
Table 2: Hours of sunlight necessary to fully charge each battery; by solar panel size. From original article.
A 5 W solar panel – the smallest 12V solar panel commercially available – is the absolute minimum required to run a solar powered website. However, only under optimal conditions will it be able to power the server (2W) and charge the battery (3W), and it could only keep the website running through the night if the day is long enough. Because solar panels rarely generate their maximum power capacity, this would result in a website that is online only while the sun shines.
Even though the combination of a small solar panel and large battery can have the same embodied energy as the combination of a large solar panel and a small battery, the system each creates will have very different characteristics. In general, it’s best to opt for a larger solar panel and a smaller battery, because this combination increases the life expectancy of the battery – lead-acid batteries need to be fully charged from time to time or they lose storage capacity.
Embodied Energy for Batteries and Solar Panels
It takes 1.03 megajoule (MJ) to produce 1 watt-hour of lead-acid battery capacity [2], and 3,514 MJ of energy to produce one m2 of solar panel. [3] In the table below, we present the embodied energy for different sizes of batteries and solar panels and then calculate the embodied energy per year, based on a life expectancy of 5 years for batteries and 25 years for solar panels. The values are converted to kilowatt-hours per year and refer to primary energy, not electricity.
A solar powered website also needs a charge controller and of course a web server. The embodied energy for these components remains the same no matter the size of solar panel or battery. The embodied energy per year is based on a life expectancy of 10 years. [4][5]
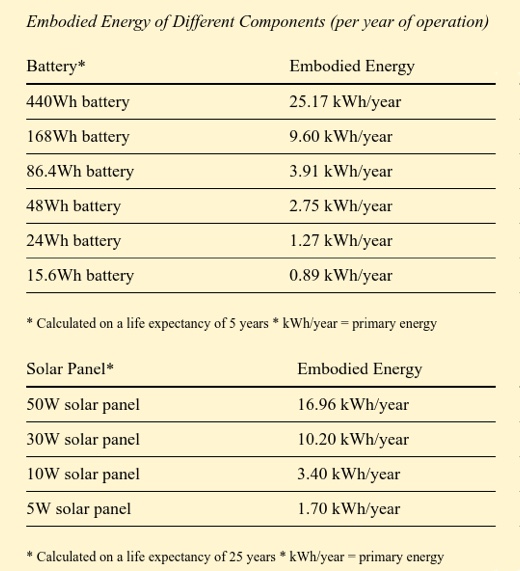
Table 3: Embodied Energy of Different Components (per ear of operation). From original article.
We now have all data to calculate the total embodied energy for each combination of solar panels and batteries. The results are presented in the table below.
The embodied energy varies by a factor of five depending on the configuration: from 10.92 kWh primary energy per year for the combination of the smallest solar panel (5W) with the smallest battery (15.6 Wh) to 50.46 kWh primary energy per year for the combination of the largest solar panel (50 W) with the largest battery (440Wh).
If we divide these results by the number of unique visitors per year (865,000), we obtain the embodied energy use per unique visitor to our website. For our original configuration with 95-98% uptime (50W solar panel, 86.4Wh battery), primary energy use per unique visitor is 0.03 Wh.
This result would be pretty similar for the other configurations with a lower uptime, because although the embodied energy is lower, so is the number of unique visitors.
How Sustainable is the Solar Powered Website?
Now that we have calculated the embodied energy of different configurations, we can calculate the carbon emissions. We can’t compare the environmental footprint of the solar powered website with that of the old website, because it is hosted elsewhere and we can’t measure its energy use.
What we can compare is the solar powered website with a similar self-hosted configuration that is run on grid power. This allows us to assess the (un)sustainability of running the website on solar power.
Life cycle analyses of solar panels are not very useful for working out the CO2-emissions of our components because they work on the assumption that all energy produced by the panels is used. This is not necessarily true in our case: the larger solar panels waste a lot of solar power in optimal weather conditions.
This means that fossil fuel use associated with running the solar powered Low-tech Magazine during the first year (50W panel, 86.4 Wh battery) corresponds to 3 litres of oil and 9 kg of carbon emissions – as much as an average European car driving a distance of 50 km. Below are the results for the other configurations:
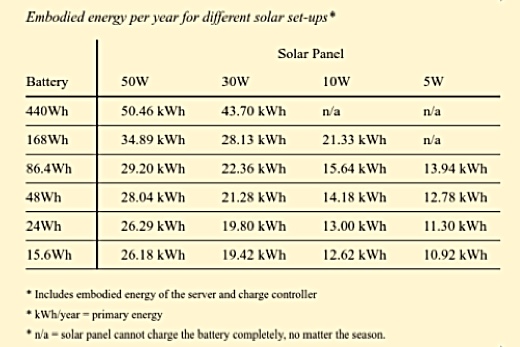
Table 4: Embodied Energy per year for different solar set-ups. From original article.
We therefore take another approach: we convert the embodied energy of our components to litres of oil (1 litre of oil is 10 kWh of primary energy) and calculate the result based on the CO2-emissions of oil (1 litre of oil produces 3 kg of greenhouse gasses, including mining and refining it). This takes into account that most solar panels and batteries are now produced in China – where the power grid is three times as carbon-intensive and 50% less energy efficient than in Europe. [6]
This means that fossil fuel use associated with running the solar powered Low-tech Magazine during the first year (50W panel, 86.4 Wh battery) corresponds to 3 litres of oil and 9 kg of carbon emissions – as much as an average European car driving a distance of 50 km. Below are the results for the other configurations:
Comparison with Carbon Intensity of Spanish Power GridNow let’s calculate the hypothetical CO2-emissions from running our self-hosted web server on grid power instead of solar power. CO2-emissions in this case depend on the Spanish power grid, which happens to be one of the least carbon intensive in Europe due to its high share of renewable and nuclear energy (respectively 36.8% and 22% in 2019).
Last year, the carbon intensity of the Spanish power grid decreased to 162 g of CO2 per kWh of electricity. For comparison, the average carbon intensity in Europe is around 300g per kWh of electricity, while the carbon intensity of the US and Chinese power grid are respectively above 400g and 900g of CO2 per kWh of electricity.
If we just look at the operational energy use of our server, which was 9.53 kWh of electricity during the first year, running it on the Spanish power grid would have produced 1.54 kg of CO2-emissions, compared to 3 - 9 kg in our tested configurations. This seems to indicate that our solar powered server is a bad idea, because even the smallest solar panel with the smallest battery generates more carbon emissions than grid power.
However, we’re comparing apples to oranges. We have calculated our emissions based on the embodied energy of our installation. When the carbon intensity of the Spanish power grid is measured, the embodied energy of the renewable power infrastructure is taken to be zero. If we calculated our carbon intensity in the same way, of course it would be zero, too.
Ignoring the embodied carbon emissions of the power infrastructure is reasonable when the grid is powered by fossil fuel power plants, because the carbon emissions to build that infrastructure are very small compared to the carbon emissions of the fuel that is burned. However, the reverse is true of renewable power sources, where operational carbon emissions are almost zero but carbon is emitted during the production of the power plants themselves.
To make a fair comparison with our solar powered server, the calculation of the carbon intensity of the Spanish power grid should take into account the emissions from the building and maintaining of the power plants, the transmission lines, and – should fossil fuel power plants eventually disappear – the energy storage. Of course, ultimately, the embodied energy of all these components would depend on the chosen uptime.
Possible Improvements
There are many ways in which the sustainability of our solar powered website could be improved while maintaining our present uptime. Producing solar panels and batteries using electricity from the Spanish grid would have the largest impact in terms of carbon emissions, because the carbon footprint of our configuration would be roughly 5 times lower than it is now.
What we can do ourselves is lower the operational energy use of the server and improve the system efficiency of the solar PV installation. Both would allow us to run the server with a smaller battery and solar panel, thereby reducing embodied energy. We could also switch to another type of energy storage or even another type of energy source.
Server
We already made some changes that have resulted in a lower operational energy use of the server. For example, we discovered that more than half of total data traffic on our server (6.63 of 11.16 TB) was caused by a single broken RSS implementation that pulled our feed every couple of minutes.
Fixing this as well as some other changes lowered the power use of the server (excluding energy losses) from 1.14 watts to about 0.95 watts. The gain may seem small, but a difference in power use of 0.19 watts adds up to 4.56 watt-hour over the course of 24 hours, which means that the website can stay online for more than 2.5 hours longer.
System Efficiency
System efficiency was only 50% during the first year. Energy losses were experienced during charging and discharging of the battery (22%), as well as in the voltage conversion from 12V (solar PV system) to 5V (USB connection), where the losses add up to 28%. The initial voltage converter we built was pretty suboptimum (our solar charge controller doesn't have a built-in USB-connection), so we could build a better one, or switch to a 5V solar PV set-up.
Energy Storage
To increase the efficiency of the energy storage, we could replace the lead-acid batteries with more expensive lithium-ion batteries, which have lower charge/discharge losses (small-scale compressed air energy storage system
(CAES). Although low pressure CAES systems have similar efficiency to lead-acid batteries, they have much lower embodied energy due to their long life expectancy (decades instead of years).
Energy Source
Another way to lower the embodied energy is to switch renewable energy source. Solar PV power has high embodied energy compared to alternatives such as wind, water, or human power. These power sources could be harvested with little more than a generator and a voltage regulator – as the rest of the power plant could be built out of wood. Furthermore, a water-powered website wouldn’t require high-tech energy storage. If you’re in a cold climate, you could even operate a website on the heat of a wood stove, using a thermo-electric generator.
Solar Tracker
People who have a good supply of wind or water power could build a system with lower embodied energy than ours. However, unless the author starts powering his website by hand or foot, we’re pretty much stuck with solar power. The biggest improvement we could make is to add a solar tracker that makes the panel follow the sun, which could increase electricity generation by as much as 30%, and allow us to obtain a better uptime with a smaller panel.
Let’s Scale Things Up !
A final way to improve the sustainability of our system would be to scale it up: run more websites on a server, and run more (and larger) servers on a solar PV system. This set-up would have much lower embodied energy than an oversized system for each website alone.
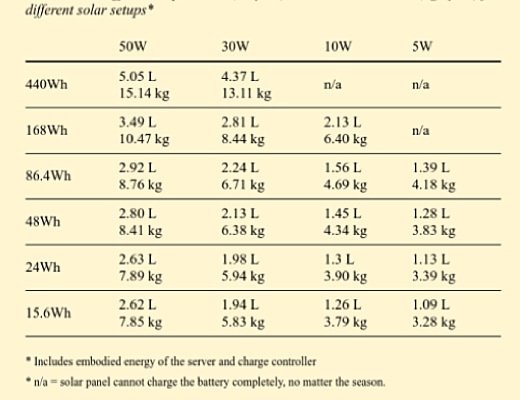
Table 5: Different solar setups includes embobied energy of the server and charge controller. From original article.
Solar Webhosting Company
If we were to fill the author’s balcony with solar panels and start a solar powered webhosting company, the embodied energy per unique visitor would decrease significantly. We would need only one server for multiple websites, and only one solar charge controller for multiple solar panels.
Voltage conversion would be more energy efficient, and both solar and battery power could be shared by all websites, which brings economies of scale.
Of course, this is the very concept of the data center, and although we have no ambition to start such a business, others could take this idea forward: towards a data center that is run just as efficiently as any other data center today, but which is powered by renewables and goes off-line when the weather is bad.
Add More Websites
We found that the capacity of our server is large enough to host more websites, so we already took a small step towards economies of scale by moving the Spanish and French versions of Low-tech Magazine to the solar powered server (as well as some other translations).
Although this move will increase our operational energy use and potentially also our embodied energy use, we also eliminate other websites that are or were hosted elsewhere. We also have to keep in mind that the number of unique visitors to Low-tech Magazine may grow in the future, so we need to become more energy efficient just to maintain our environmental footprint.
Combine Server and Lighting
Another way to achieve economies of scale would give a whole new twist to the idea. The solar powered server is part of the author’s household, which is also partly powered by off-grid solar energy. We could test different sizes of batteries and solar panels – simply swapping components between solar installations.
When we were running the server on the 50 W panel, the author was running the lights in the living room on a 10W panel – and was often left sitting in the dark. When we were running the server on the 10 W panel, it was the other way around: there was more light in the household, at the expense of a lower server uptime.
Let’s say we run both the lights and the server on one solar PV system. It would lower the embodied energy if both systems are considered, because only one solar charge controller would be needed.
Furthermore, it could result in a much smaller battery and solar panel (compared to two separate systems), because if the weather gets bad, the author could decide not to use the lights and keep the server online – or the other way around. This flexibility is not available now, because the server is the only load and its power use cannot be easily manipulated.
Energy Use in the Network
As far as we know, ours is the first life cycle analysis of a website that runs entirely on renewable energy and includes the embodied energy of its power and energy storage infrastructure. However, this is not, of course, the total energy use associated with this website.
There’s also the operational and embodied energy of the network infrastructure (which includes our router, the internet backbone, and the mobile phone network), and the operational and embodied energy of the devices that our visitors use to access our website: smartphones, tablets, laptops, desktops. Some of these have low operational energy use, but they all have very limited lifespans and thus high embodied energy.
Energy use in the network is directly related to the bit rate of the data traffic that runs through it, so our lightweight website is just as efficient in the communication network as it is on our server. However, we have very little influence over which devices people use to access our website, and the direct advantage of our design is much smaller here than in the network.
For example, our website has the potential to increase the life expectancy of computers, because it’s light enough to be accessed with very old machines. Unfortunately, our website alone will not make people use their computers for longer.
That said, both the network infrastructure and the end-use devices could be re-imagined along the lines of the solar powered website – downscaled and powered by renewable energy sources with limited energy storage.
Parts of the network infrastructure could go off-line if the local weather is bad, and your e-mail may be temporarily stored in a rainstorm 3.000 km away. This type of network infrastructure actually exists in some countries, and those networks partly inspired this solar powered website. The end-use devices could have low energy use and long life expectancy.
Because the total energy use of the internet is usually measured to be roughly equally distributed over servers, network, and end-use devices (all including the manufacturing of the devices), we can make a rough estimate of the total energy use of this website throughout a re-imagined internet.
For our original set-up with 95.2% uptime, this would be 87.6 kWh of primary energy, which corresponds to 9 litres of oil and 27 kg of CO2. The improvements we outlined earlier could bring these numbers further down, because in this calculation the whole internet is powered by oversized solar PV systems on balconies.
Authors: Kris De Decker, Roel Roscam Abbing, Marie Otsuka
llustrations by Diego Marmolejo.
Thanks to Kathy Vanhout, Adriana Parra and Gauthier Roussilhe.
By Kris De Decker on 1 February 2020 for Low Tech Magazine -
(https://www.lowtechmagazine.com/2020/01/how-sustainable-is-a-solar-powered-website.html)
Image above: Diagram of home solar powered website. From original article. A simple representation of the system. A charge controller powered by a 50w solar panel charges a 168wh battery that runs a server to an internet router. The voltage conversion (between the 12V charge controller and the 5V server) and the battery meter (between the server and the battery) are missing.
(IB Editor's note: I just checked Amazon. A solar charge controller that meets the needs of this home base powered website server costs $10.97 with free Prime shipping. See (https://www.amazon.com/EEEKit-Controller-Intelligent-Multi-Function-Adjustable/dp/B07R8TRJ8C). I've had one for years attached to four 110ah dee cycle marine batteries keeping the LED lighting on in my shop. I think I paid over $30 for it then.)
.
Introduction
In September 2018, Low-tech Magazine launched a new website that aimed to radically reduce the energy use and carbon emissions associated with accessing its content. Internet energy use is growing quickly on account of both increasing bit rates (online content gets “heavier”) and increased time spent online (especially since the arrival of mobile computing and wireless internet).
The solar powered website bucks against these trends. To drop energy use far below that of the average website, we opted for a back-to-basics web design, using a static website instead of a database driven content management system. To reduce the energy use associated with the production of the solar panel and the battery, we chose a minimal set-up and accepted that the website goes off-line when the weather is bad.
We have been monitoring the solar powered server for 15 months now, and we have collected data on uptime, energy use, power use, system efficiency, and visitor traffic. We also calculated how much energy was required to make the solar panel, the battery, the charge controller and the server.
Uptime, Electricity Use & System Efficiency
The solar powered website goes off-line when the weather is bad – but how often does that happen? For a period of about one year (351 days, from 12 December 2018 to 28 November 2019), we achieved an uptime of 95.26%. This means that we were off-line due to bad weather for 399 hours.
If we ignore the last two months, our uptime was 98.2%, with a downtime of only 152 hours. Uptime plummeted to 80% during the last two months, when a software upgrade increased the energy use of the server. This knocked the website off-line for at least a few hours every night.
Let’s have a look at the electricity used by our web server (the “operational” energy use). We have measurements from the server and from the solar charge controller. Comparing both values reveals the inefficiencies in the system. Over a period of roughly one year (from 3 December 2018 to 24 November 2019), the electricity use of our server was 9.53 kilowatt-hours (kWh).
We measured significant losses in the solar PV system due to voltage conversions and charge/discharge losses in the battery. The solar charge controller showed a yearly electricity use of 18.10 kWh, meaning that system efficiency was roughly 50%.
During the period under study, the solar powered website received 865,000 unique visitors. Including all energy losses in the solar set-up, electricity use per unique visitor is then 0.021 watt-hour. One kilowatt-hour of solar generated electricity can thus serve almost 50,000 unique visitors, and one watt-hour of electricity can serve roughly 50 unique visitors. This is all renewable energy and as such there are no direct associated carbon emissions.
Embodied Energy Use & Uptime
The story often ends here when renewable energy is presented as a solution for the growing energy use of the internet. When researchers examine the energy use of data centers, which host the content that is accessible on the internet, they never take into account the energy that is required to build and maintain the infrastructure that powers those data centers.There is no such omission with a self-hosted website powered by an off-the-grid solar PV installation. The solar panel, the battery, and the solar charge controller are equally essential parts of the installation as the server itself. Consequently, energy use for the mining of the resources and the manufacture of these components – the “embodied energy” – must also be taken into account.
Image above: Diagram of five servers powrf two 168wh batteries charged by two 50w solar panels a charge controller powered by two 50watt solar panels that charge two 168wh batteries.
Unfortunately, most of this energy comes from fossil fuels, either in the form of diesel (mining the raw materials and transporting the components) or in the form of electricity generated mainly by fossil fuel power plants (most manufacturing processes).
The embodied energy of our configuration is mainly determined by the size of the battery and the solar panel. At the same time, the size of battery and solar panel determine how often the website will be online (the “uptime”). Consequently, the sizing of battery and solar panel is a compromise between uptime and sustainability.
To find the optimal balance, we have run (and keep running) our system with different combinations of solar panels and batteries. Uptime and embodied energy are also determined by the local weather conditions, so the results we present here are only valid for our location (the balcony of the author’s home near Barcelona, Spain).
Uptime and Battery size
Battery storage capacity determines how long the website can run without a supply of solar power. A minimum of energy storage is required to get through the night, while additional storage can compensate for a certain period of low (or no) solar power production during the day. Batteries deteriorate with age, so it’s best to start with more capacity than is actually needed, otherwise the battery needs to be replaced rather quickly.Greater than 90% Uptime
First, let’s calculate the minimum energy storage needed to keep the website online during the night, provided that the weather is good, the battery is new, and the solar panel is large enough to charge the battery completely. The average power use of our web server during the first year, including all energy losses in the solar installation, was 1.97 watts. During the shortest night of the year (8h50, June 21), we need 17.40 watt-hour of storage capacity, and during the longest night of the year (14h49, December 21), we need 29.19 Wh.
Table 1: Minimum energy required to keep website on line during the night. From original article.
Because lead-acid batteries should not be discharged below half of their capacity, the solar powered server requires a 60 Wh lead-acid battery to get through the shortest nights when solar conditions are optimal (2 x 29.19Wh). For most of the year we ran the system with a slightly larger energy storage (up to 86.4 Wh) and a 50W solar panel, and achieved the above mentioned uptime of 95-98%. [1]
100% Uptime
A larger battery would keep the website running even during longer periods of bad weather, again provided that the solar panel is large enough to charge the battery completely. To compensate for each day of very bad weather (no significant power production), we need 47.28 watt-hour (24h x 1.97 watts) of storage capacity.
From 1 December 2019 to 12 January 2020, we combined the 50 W solar panel with a 168 watt-hour battery, which has a practical storage capacity of 84 watt-hour. This is enough storage to keep the website running for two nights and a day. Even though we tested this configuration during the darkest period of the year, we had relatively nice weather and achieved an uptime of 100%.
However, to assure an uptime of 100% over a period of years would require more energy storage. To keep the website online during four days of low or no power production, we would need a 440 watt-hour lead-acid battery – the size of a car battery. We include this configuration to represent the conventional approach to off-grid solar power.
We also made calculations for batteries that aren’t large enough to get the website through the shortest night of the year: 48 Wh, 24 Wh, and 15.6 Wh (with practical storage capacities of 24 Wh, 12 Wh, and 7.8 Wh, respectively). The latter is the smallest lead-acid battery commercially available.
If the weather is good, the 48 Wh lead-acid battery will keep the server running during the night from March to September. The 24 Wh lead acid-battery can keep the website online for a maximum of 6 hours, meaning that the server will go off-line each night of the year, although at different hours depending on the season.
Finally, the 15.6 Wh battery keeps the website online for only four hours when there’s no solar power. Even if the weather is good, the server will stop working around 1 am in summer and around 9 pm in winter. The maximum uptime for the smallest battery would be around 50%, and in practice it will be lower due to clouds and rain.
A website that goes off-line in evening could be an interesting option for a local online publication with low anticipated traffic after midnight. However, since Low-tech Magazine’s readership is almost equally divided between Europe and the USA this is not an attractive option. If the website goes down every night, our American readers could only access it during the morning.
Uptime and Solar Panel Size
The uptime of the solar powered website is not only determined by the battery, but also by the solar panel, especially in relation to bad weather. The larger the solar panel, the quicker it will charge the battery and fewer hours of sun will be needed to get the website through the night. For example, with the 50 W solar panel, one to two hours of full sun are sufficient to completely charge any of the batteries (except for the car battery).
Table 2: Hours of sunlight necessary to fully charge each battery; by solar panel size. From original article.
A 5 W solar panel – the smallest 12V solar panel commercially available – is the absolute minimum required to run a solar powered website. However, only under optimal conditions will it be able to power the server (2W) and charge the battery (3W), and it could only keep the website running through the night if the day is long enough. Because solar panels rarely generate their maximum power capacity, this would result in a website that is online only while the sun shines.
Even though the combination of a small solar panel and large battery can have the same embodied energy as the combination of a large solar panel and a small battery, the system each creates will have very different characteristics. In general, it’s best to opt for a larger solar panel and a smaller battery, because this combination increases the life expectancy of the battery – lead-acid batteries need to be fully charged from time to time or they lose storage capacity.
Embodied Energy for Batteries and Solar Panels
It takes 1.03 megajoule (MJ) to produce 1 watt-hour of lead-acid battery capacity [2], and 3,514 MJ of energy to produce one m2 of solar panel. [3] In the table below, we present the embodied energy for different sizes of batteries and solar panels and then calculate the embodied energy per year, based on a life expectancy of 5 years for batteries and 25 years for solar panels. The values are converted to kilowatt-hours per year and refer to primary energy, not electricity.
A solar powered website also needs a charge controller and of course a web server. The embodied energy for these components remains the same no matter the size of solar panel or battery. The embodied energy per year is based on a life expectancy of 10 years. [4][5]
Table 3: Embodied Energy of Different Components (per ear of operation). From original article.
We now have all data to calculate the total embodied energy for each combination of solar panels and batteries. The results are presented in the table below.
The embodied energy varies by a factor of five depending on the configuration: from 10.92 kWh primary energy per year for the combination of the smallest solar panel (5W) with the smallest battery (15.6 Wh) to 50.46 kWh primary energy per year for the combination of the largest solar panel (50 W) with the largest battery (440Wh).
If we divide these results by the number of unique visitors per year (865,000), we obtain the embodied energy use per unique visitor to our website. For our original configuration with 95-98% uptime (50W solar panel, 86.4Wh battery), primary energy use per unique visitor is 0.03 Wh.
This result would be pretty similar for the other configurations with a lower uptime, because although the embodied energy is lower, so is the number of unique visitors.
How Sustainable is the Solar Powered Website?
Now that we have calculated the embodied energy of different configurations, we can calculate the carbon emissions. We can’t compare the environmental footprint of the solar powered website with that of the old website, because it is hosted elsewhere and we can’t measure its energy use.
What we can compare is the solar powered website with a similar self-hosted configuration that is run on grid power. This allows us to assess the (un)sustainability of running the website on solar power.
Life cycle analyses of solar panels are not very useful for working out the CO2-emissions of our components because they work on the assumption that all energy produced by the panels is used. This is not necessarily true in our case: the larger solar panels waste a lot of solar power in optimal weather conditions.
This means that fossil fuel use associated with running the solar powered Low-tech Magazine during the first year (50W panel, 86.4 Wh battery) corresponds to 3 litres of oil and 9 kg of carbon emissions – as much as an average European car driving a distance of 50 km. Below are the results for the other configurations:
Table 4: Embodied Energy per year for different solar set-ups. From original article.
We therefore take another approach: we convert the embodied energy of our components to litres of oil (1 litre of oil is 10 kWh of primary energy) and calculate the result based on the CO2-emissions of oil (1 litre of oil produces 3 kg of greenhouse gasses, including mining and refining it). This takes into account that most solar panels and batteries are now produced in China – where the power grid is three times as carbon-intensive and 50% less energy efficient than in Europe. [6]
This means that fossil fuel use associated with running the solar powered Low-tech Magazine during the first year (50W panel, 86.4 Wh battery) corresponds to 3 litres of oil and 9 kg of carbon emissions – as much as an average European car driving a distance of 50 km. Below are the results for the other configurations:
Comparison with Carbon Intensity of Spanish Power GridNow let’s calculate the hypothetical CO2-emissions from running our self-hosted web server on grid power instead of solar power. CO2-emissions in this case depend on the Spanish power grid, which happens to be one of the least carbon intensive in Europe due to its high share of renewable and nuclear energy (respectively 36.8% and 22% in 2019).
Last year, the carbon intensity of the Spanish power grid decreased to 162 g of CO2 per kWh of electricity. For comparison, the average carbon intensity in Europe is around 300g per kWh of electricity, while the carbon intensity of the US and Chinese power grid are respectively above 400g and 900g of CO2 per kWh of electricity.
If we just look at the operational energy use of our server, which was 9.53 kWh of electricity during the first year, running it on the Spanish power grid would have produced 1.54 kg of CO2-emissions, compared to 3 - 9 kg in our tested configurations. This seems to indicate that our solar powered server is a bad idea, because even the smallest solar panel with the smallest battery generates more carbon emissions than grid power.
However, we’re comparing apples to oranges. We have calculated our emissions based on the embodied energy of our installation. When the carbon intensity of the Spanish power grid is measured, the embodied energy of the renewable power infrastructure is taken to be zero. If we calculated our carbon intensity in the same way, of course it would be zero, too.
Ignoring the embodied carbon emissions of the power infrastructure is reasonable when the grid is powered by fossil fuel power plants, because the carbon emissions to build that infrastructure are very small compared to the carbon emissions of the fuel that is burned. However, the reverse is true of renewable power sources, where operational carbon emissions are almost zero but carbon is emitted during the production of the power plants themselves.
To make a fair comparison with our solar powered server, the calculation of the carbon intensity of the Spanish power grid should take into account the emissions from the building and maintaining of the power plants, the transmission lines, and – should fossil fuel power plants eventually disappear – the energy storage. Of course, ultimately, the embodied energy of all these components would depend on the chosen uptime.
Possible Improvements
There are many ways in which the sustainability of our solar powered website could be improved while maintaining our present uptime. Producing solar panels and batteries using electricity from the Spanish grid would have the largest impact in terms of carbon emissions, because the carbon footprint of our configuration would be roughly 5 times lower than it is now.
What we can do ourselves is lower the operational energy use of the server and improve the system efficiency of the solar PV installation. Both would allow us to run the server with a smaller battery and solar panel, thereby reducing embodied energy. We could also switch to another type of energy storage or even another type of energy source.
Server
We already made some changes that have resulted in a lower operational energy use of the server. For example, we discovered that more than half of total data traffic on our server (6.63 of 11.16 TB) was caused by a single broken RSS implementation that pulled our feed every couple of minutes.
Fixing this as well as some other changes lowered the power use of the server (excluding energy losses) from 1.14 watts to about 0.95 watts. The gain may seem small, but a difference in power use of 0.19 watts adds up to 4.56 watt-hour over the course of 24 hours, which means that the website can stay online for more than 2.5 hours longer.
System Efficiency
System efficiency was only 50% during the first year. Energy losses were experienced during charging and discharging of the battery (22%), as well as in the voltage conversion from 12V (solar PV system) to 5V (USB connection), where the losses add up to 28%. The initial voltage converter we built was pretty suboptimum (our solar charge controller doesn't have a built-in USB-connection), so we could build a better one, or switch to a 5V solar PV set-up.
Energy Storage
To increase the efficiency of the energy storage, we could replace the lead-acid batteries with more expensive lithium-ion batteries, which have lower charge/discharge losses (small-scale compressed air energy storage system
(CAES). Although low pressure CAES systems have similar efficiency to lead-acid batteries, they have much lower embodied energy due to their long life expectancy (decades instead of years).
Energy Source
Another way to lower the embodied energy is to switch renewable energy source. Solar PV power has high embodied energy compared to alternatives such as wind, water, or human power. These power sources could be harvested with little more than a generator and a voltage regulator – as the rest of the power plant could be built out of wood. Furthermore, a water-powered website wouldn’t require high-tech energy storage. If you’re in a cold climate, you could even operate a website on the heat of a wood stove, using a thermo-electric generator.
Solar Tracker
People who have a good supply of wind or water power could build a system with lower embodied energy than ours. However, unless the author starts powering his website by hand or foot, we’re pretty much stuck with solar power. The biggest improvement we could make is to add a solar tracker that makes the panel follow the sun, which could increase electricity generation by as much as 30%, and allow us to obtain a better uptime with a smaller panel.
Let’s Scale Things Up !
Table 5: Different solar setups includes embobied energy of the server and charge controller. From original article.
Solar Webhosting Company
If we were to fill the author’s balcony with solar panels and start a solar powered webhosting company, the embodied energy per unique visitor would decrease significantly. We would need only one server for multiple websites, and only one solar charge controller for multiple solar panels.
Voltage conversion would be more energy efficient, and both solar and battery power could be shared by all websites, which brings economies of scale.
Of course, this is the very concept of the data center, and although we have no ambition to start such a business, others could take this idea forward: towards a data center that is run just as efficiently as any other data center today, but which is powered by renewables and goes off-line when the weather is bad.
Add More Websites
We found that the capacity of our server is large enough to host more websites, so we already took a small step towards economies of scale by moving the Spanish and French versions of Low-tech Magazine to the solar powered server (as well as some other translations).
Although this move will increase our operational energy use and potentially also our embodied energy use, we also eliminate other websites that are or were hosted elsewhere. We also have to keep in mind that the number of unique visitors to Low-tech Magazine may grow in the future, so we need to become more energy efficient just to maintain our environmental footprint.
Combine Server and Lighting
Another way to achieve economies of scale would give a whole new twist to the idea. The solar powered server is part of the author’s household, which is also partly powered by off-grid solar energy. We could test different sizes of batteries and solar panels – simply swapping components between solar installations.
When we were running the server on the 50 W panel, the author was running the lights in the living room on a 10W panel – and was often left sitting in the dark. When we were running the server on the 10 W panel, it was the other way around: there was more light in the household, at the expense of a lower server uptime.
Let’s say we run both the lights and the server on one solar PV system. It would lower the embodied energy if both systems are considered, because only one solar charge controller would be needed.
Furthermore, it could result in a much smaller battery and solar panel (compared to two separate systems), because if the weather gets bad, the author could decide not to use the lights and keep the server online – or the other way around. This flexibility is not available now, because the server is the only load and its power use cannot be easily manipulated.
Energy Use in the Network
As far as we know, ours is the first life cycle analysis of a website that runs entirely on renewable energy and includes the embodied energy of its power and energy storage infrastructure. However, this is not, of course, the total energy use associated with this website.
There’s also the operational and embodied energy of the network infrastructure (which includes our router, the internet backbone, and the mobile phone network), and the operational and embodied energy of the devices that our visitors use to access our website: smartphones, tablets, laptops, desktops. Some of these have low operational energy use, but they all have very limited lifespans and thus high embodied energy.
Energy use in the network is directly related to the bit rate of the data traffic that runs through it, so our lightweight website is just as efficient in the communication network as it is on our server. However, we have very little influence over which devices people use to access our website, and the direct advantage of our design is much smaller here than in the network.
For example, our website has the potential to increase the life expectancy of computers, because it’s light enough to be accessed with very old machines. Unfortunately, our website alone will not make people use their computers for longer.
That said, both the network infrastructure and the end-use devices could be re-imagined along the lines of the solar powered website – downscaled and powered by renewable energy sources with limited energy storage.
Parts of the network infrastructure could go off-line if the local weather is bad, and your e-mail may be temporarily stored in a rainstorm 3.000 km away. This type of network infrastructure actually exists in some countries, and those networks partly inspired this solar powered website. The end-use devices could have low energy use and long life expectancy.
Because the total energy use of the internet is usually measured to be roughly equally distributed over servers, network, and end-use devices (all including the manufacturing of the devices), we can make a rough estimate of the total energy use of this website throughout a re-imagined internet.
For our original set-up with 95.2% uptime, this would be 87.6 kWh of primary energy, which corresponds to 9 litres of oil and 27 kg of CO2. The improvements we outlined earlier could bring these numbers further down, because in this calculation the whole internet is powered by oversized solar PV systems on balconies.
Authors: Kris De Decker, Roel Roscam Abbing, Marie Otsuka
llustrations by Diego Marmolejo.
Thanks to Kathy Vanhout, Adriana Parra and Gauthier Roussilhe.
No comments :
Post a Comment